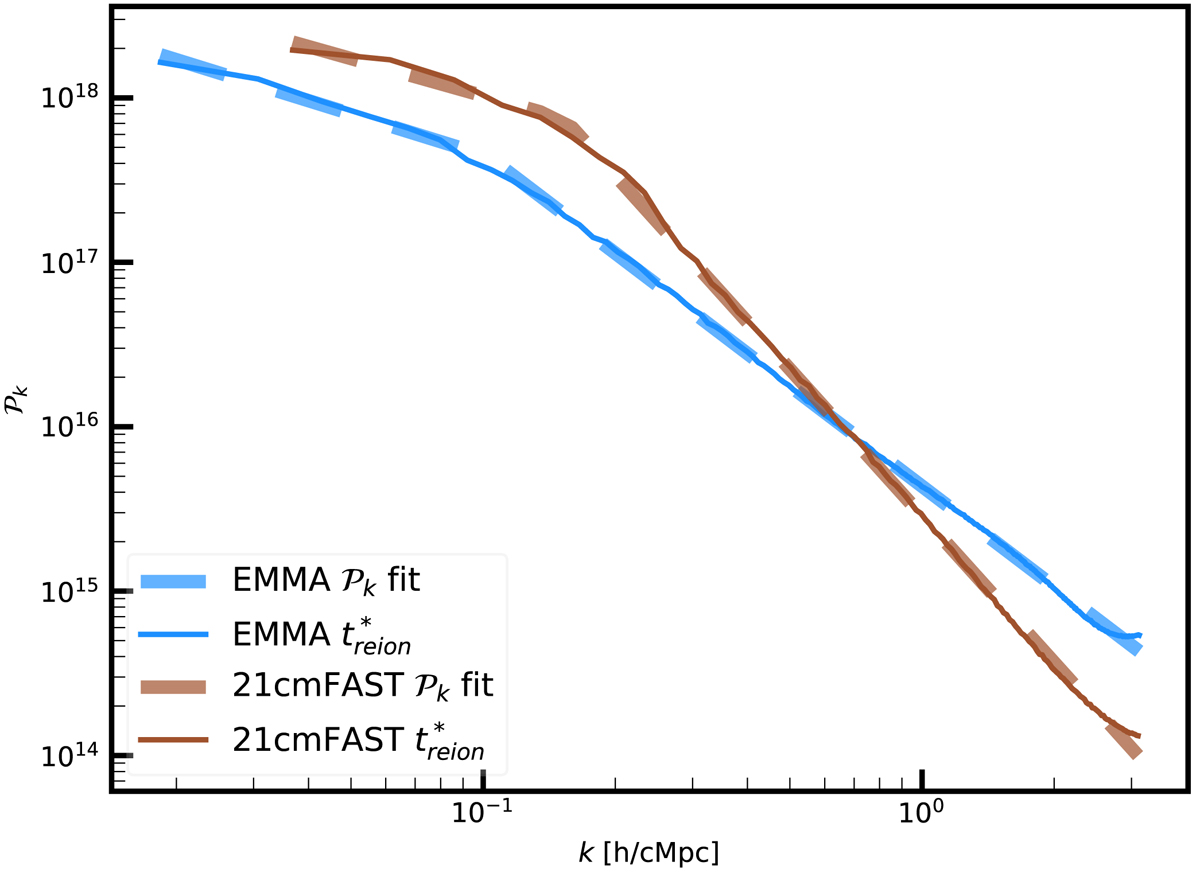
Fig. 4.
Download original image
Fitting (in dashed lines) of the reionisation time power spectra. The straight lines correspond to the power spectrum measured on the fields of each simulation (EMMA in blue and 21cmFAST in brown). The fittings are done on the average logarithmic power spectrum of every 2D slice for each field. The fields are not normalised when the fitting is carried out.
Current usage metrics show cumulative count of Article Views (full-text article views including HTML views, PDF and ePub downloads, according to the available data) and Abstracts Views on Vision4Press platform.
Data correspond to usage on the plateform after 2015. The current usage metrics is available 48-96 hours after online publication and is updated daily on week days.
Initial download of the metrics may take a while.