Fig. 2.
Download original image
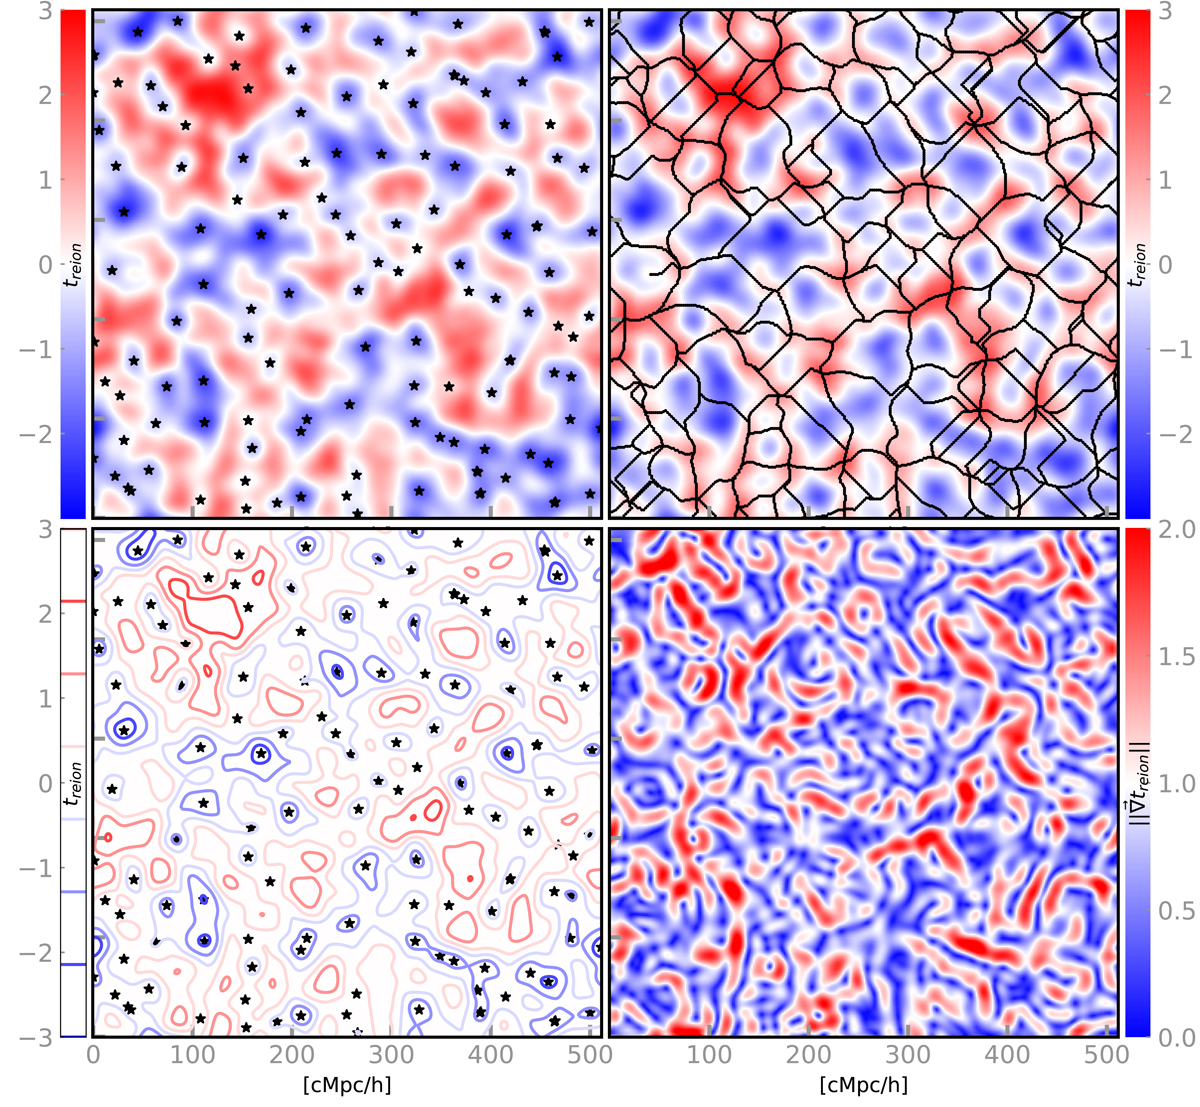
Two-dimensional slices related to the EMMA reionisation time field that are smoothed with a Gaussian kernel with a standard deviation of Rf = 6. The top left panel shows treion(r) with its minima (black stars). The top right panel shows treion(r) with its skeleton (black lines). The bottom left panel shows the isocontours of treion(r), with its minima again in black stars. Here, the reionisation time field is normalised to put its mean at a value of 0, and its standard deviation at 1. The bottom right panel shows the norm of the gradient of treion(r).
Current usage metrics show cumulative count of Article Views (full-text article views including HTML views, PDF and ePub downloads, according to the available data) and Abstracts Views on Vision4Press platform.
Data correspond to usage on the plateform after 2015. The current usage metrics is available 48-96 hours after online publication and is updated daily on week days.
Initial download of the metrics may take a while.