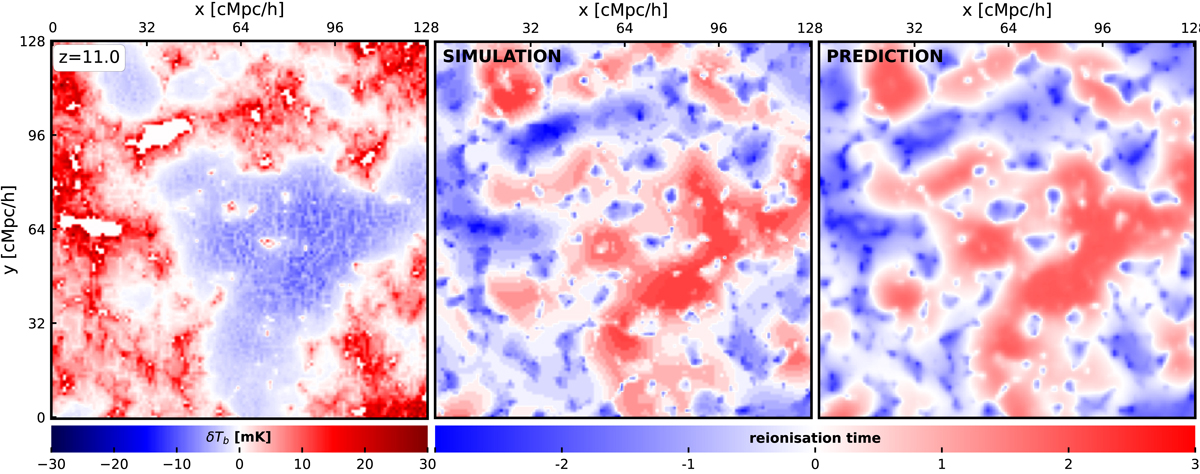
Fig. A.1.
Download original image
Example reconstruction of a 2D reionisation time map from a 2D map of the 21 cm signal taken at a redshift of z = 11. The left and middle panels are the brightness temperature and reionisation time fields generated by a 21cmFAST simulation. The right panel is the reconstruction of the reionisation times with the neural network designed to reproduce the true reionisation time map of the middle panel. Both treion(r) maps are dimensionless.
Current usage metrics show cumulative count of Article Views (full-text article views including HTML views, PDF and ePub downloads, according to the available data) and Abstracts Views on Vision4Press platform.
Data correspond to usage on the plateform after 2015. The current usage metrics is available 48-96 hours after online publication and is updated daily on week days.
Initial download of the metrics may take a while.