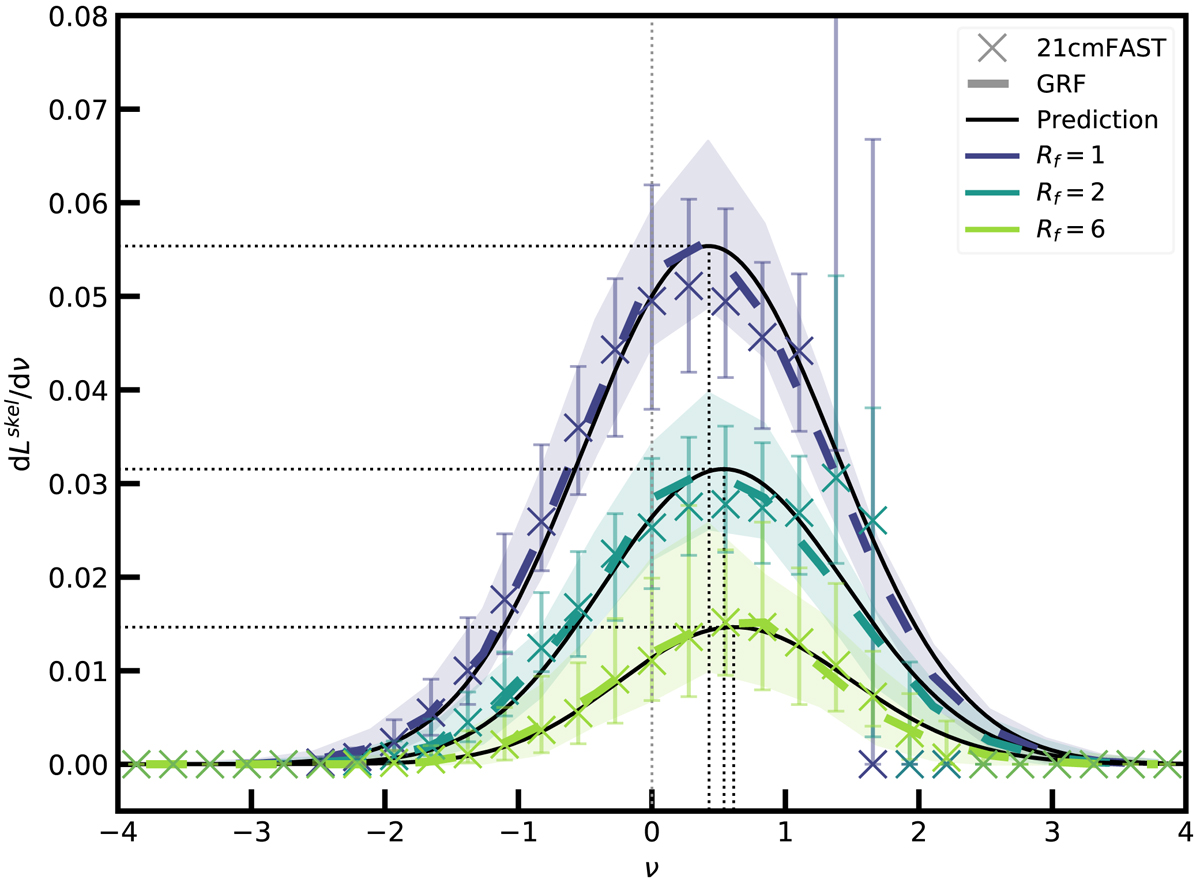
Fig. 17.
Download original image
Distribution of the skeleton length of the fields for the different smoothings (in colours). The median of every run is computed for each field. The dashed lines correspond to the GRFs, and the crosses are for the 21cmFAST reionisation time fields. The black lines are the theoretical predictions. The shaded areas and the error bars represent the dispersion around the median (1st and 99th percentiles) of the GRFs and treion(r), respectively. The black dotted vertical lines represent the average of the predictions. Here, ν represents the value of the normalised reionisation times.
Current usage metrics show cumulative count of Article Views (full-text article views including HTML views, PDF and ePub downloads, according to the available data) and Abstracts Views on Vision4Press platform.
Data correspond to usage on the plateform after 2015. The current usage metrics is available 48-96 hours after online publication and is updated daily on week days.
Initial download of the metrics may take a while.