Fig. 15.
Download original image
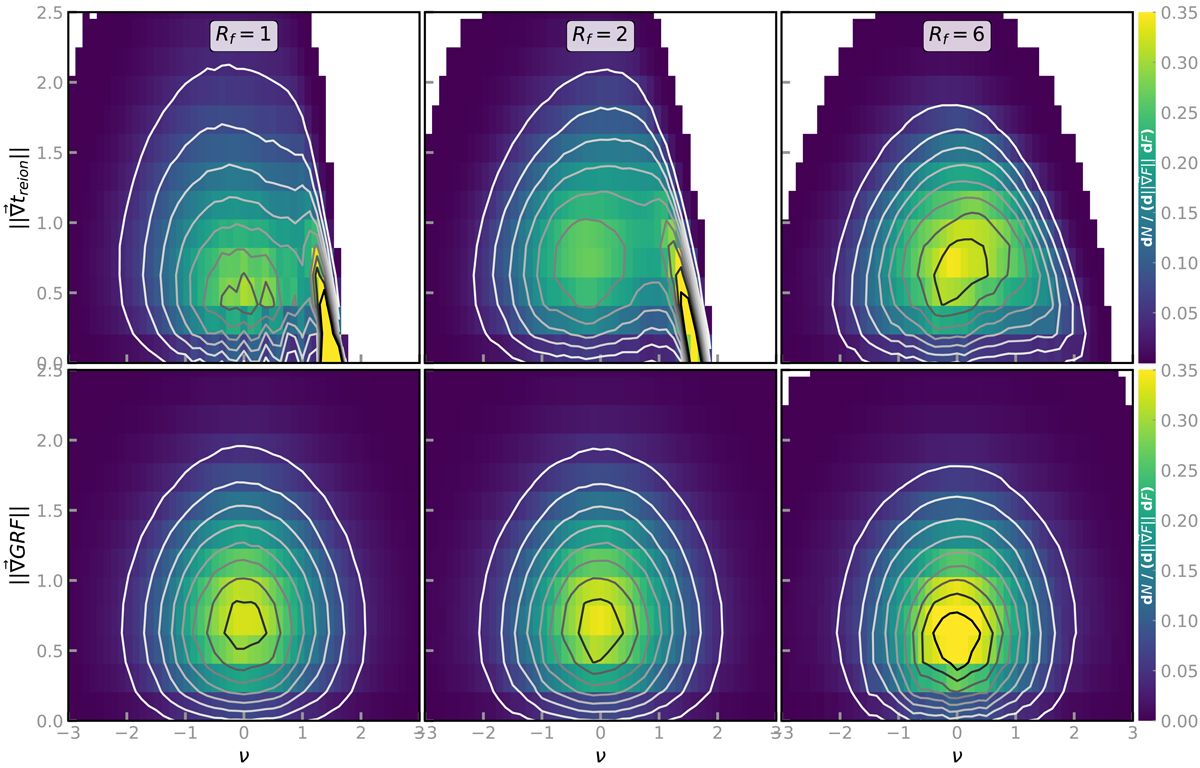
Two-dimensional PDFs of the gradient norms with respect to the values of the fields of every run for each field and different smoothings (Rf ∈ {1, 2, 6}, see each column). The first row corresponds to the 21cmFAST reionisation times, and the second row to their corresponding GRFs. The grey-scale lines are the isocontours of the histograms. Here, ν represents the value of the normalised reionisation times.
Current usage metrics show cumulative count of Article Views (full-text article views including HTML views, PDF and ePub downloads, according to the available data) and Abstracts Views on Vision4Press platform.
Data correspond to usage on the plateform after 2015. The current usage metrics is available 48-96 hours after online publication and is updated daily on week days.
Initial download of the metrics may take a while.