Fig. 11.
Download original image
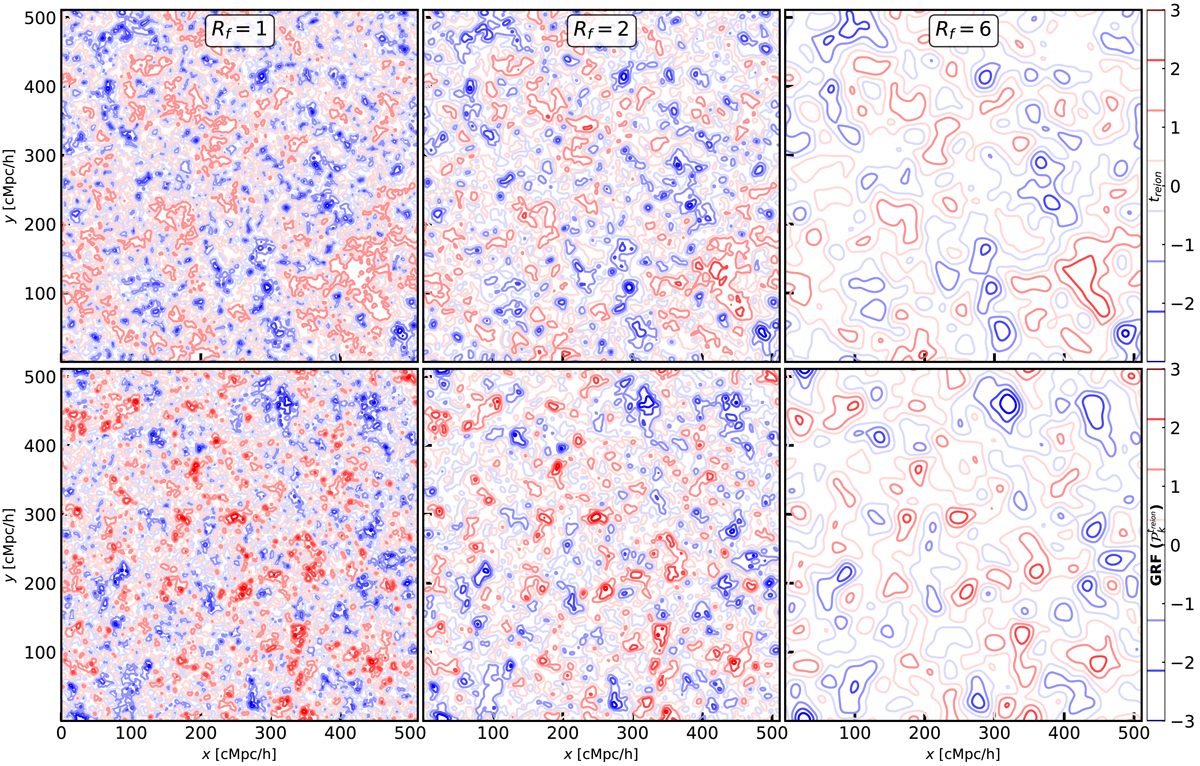
Isocontours of 2D slices of the EMMA reionisation time field (first row) and of the 2D GRF obtained with the corresponding power spectrum (second row). Each column corresponds to a different smoothing, with Rf ∈ {1, 2, 6} from left to right. All fields are normalised. Eight levels of contours are represented with the colours.
Current usage metrics show cumulative count of Article Views (full-text article views including HTML views, PDF and ePub downloads, according to the available data) and Abstracts Views on Vision4Press platform.
Data correspond to usage on the plateform after 2015. The current usage metrics is available 48-96 hours after online publication and is updated daily on week days.
Initial download of the metrics may take a while.