Fig. 10.
Download original image
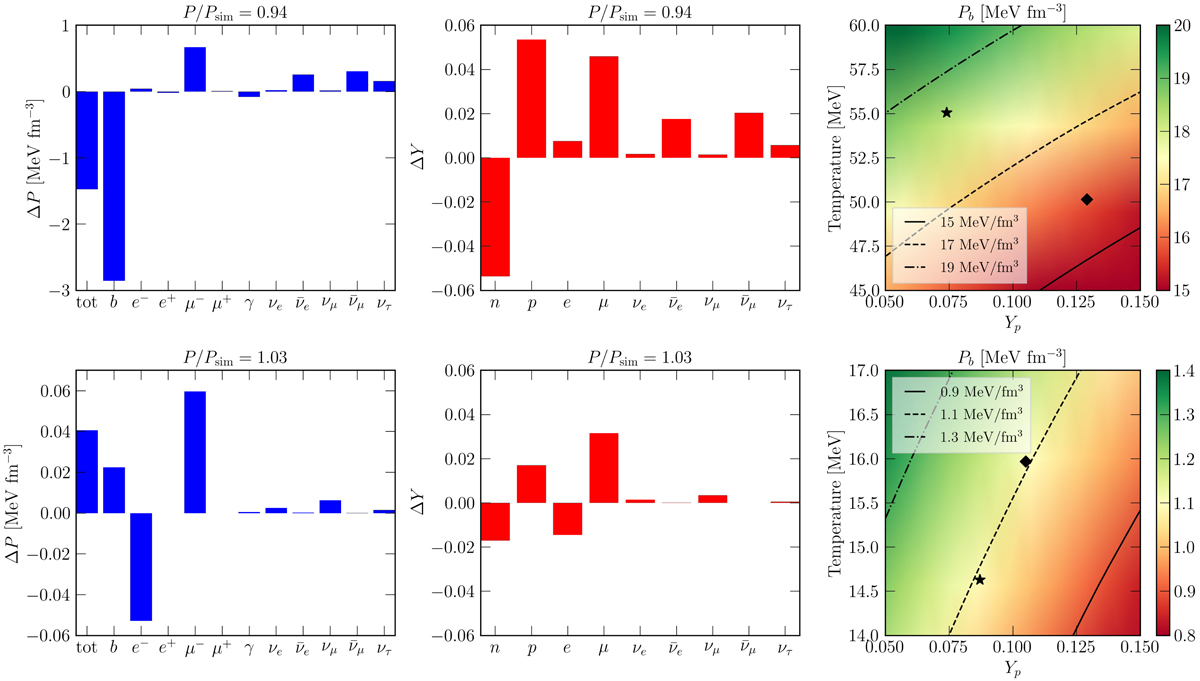
Change of particle pressure and fractions obtained in correspondence to the space-time coordinates explicitly marked in the left panel of Fig. 9 and corresponding to P/Psim = 0.94 (upper row) and P/Psim = 1.03 (lower row). The bar plots in blue (left) give the difference between the equilibrium pressure computed in post-processing and in the simulation, ![]() , where
, where ![]() , and Ptot refers to the total pressure. The bar plots in red (centre) show the difference between the particle fractions computed in post-processing and the ones from the simulation,
, and Ptot refers to the total pressure. The bar plots in red (centre) show the difference between the particle fractions computed in post-processing and the ones from the simulation, ![]() , where
, where ![]() , and e (μ) refers to the net electron (muon) fractions. The colour-coded plots (right) show Pb of BLh as a function of temperature and proton fraction for the same points. The density ρ is fixed to the value obtained in the simulation, that is, ρ = 4.3 × 10¹⁴ g cm−3 (upper row) and ρ = 1.55 ⋅ 1014 g cm−3 (lower row). The black star and the diamond mark are the values from the simulation (before post-processing) and at equilibrium (after post-processing), respectively.
, and e (μ) refers to the net electron (muon) fractions. The colour-coded plots (right) show Pb of BLh as a function of temperature and proton fraction for the same points. The density ρ is fixed to the value obtained in the simulation, that is, ρ = 4.3 × 10¹⁴ g cm−3 (upper row) and ρ = 1.55 ⋅ 1014 g cm−3 (lower row). The black star and the diamond mark are the values from the simulation (before post-processing) and at equilibrium (after post-processing), respectively.
Current usage metrics show cumulative count of Article Views (full-text article views including HTML views, PDF and ePub downloads, according to the available data) and Abstracts Views on Vision4Press platform.
Data correspond to usage on the plateform after 2015. The current usage metrics is available 48-96 hours after online publication and is updated daily on week days.
Initial download of the metrics may take a while.