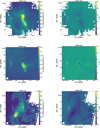
Fig. C.1
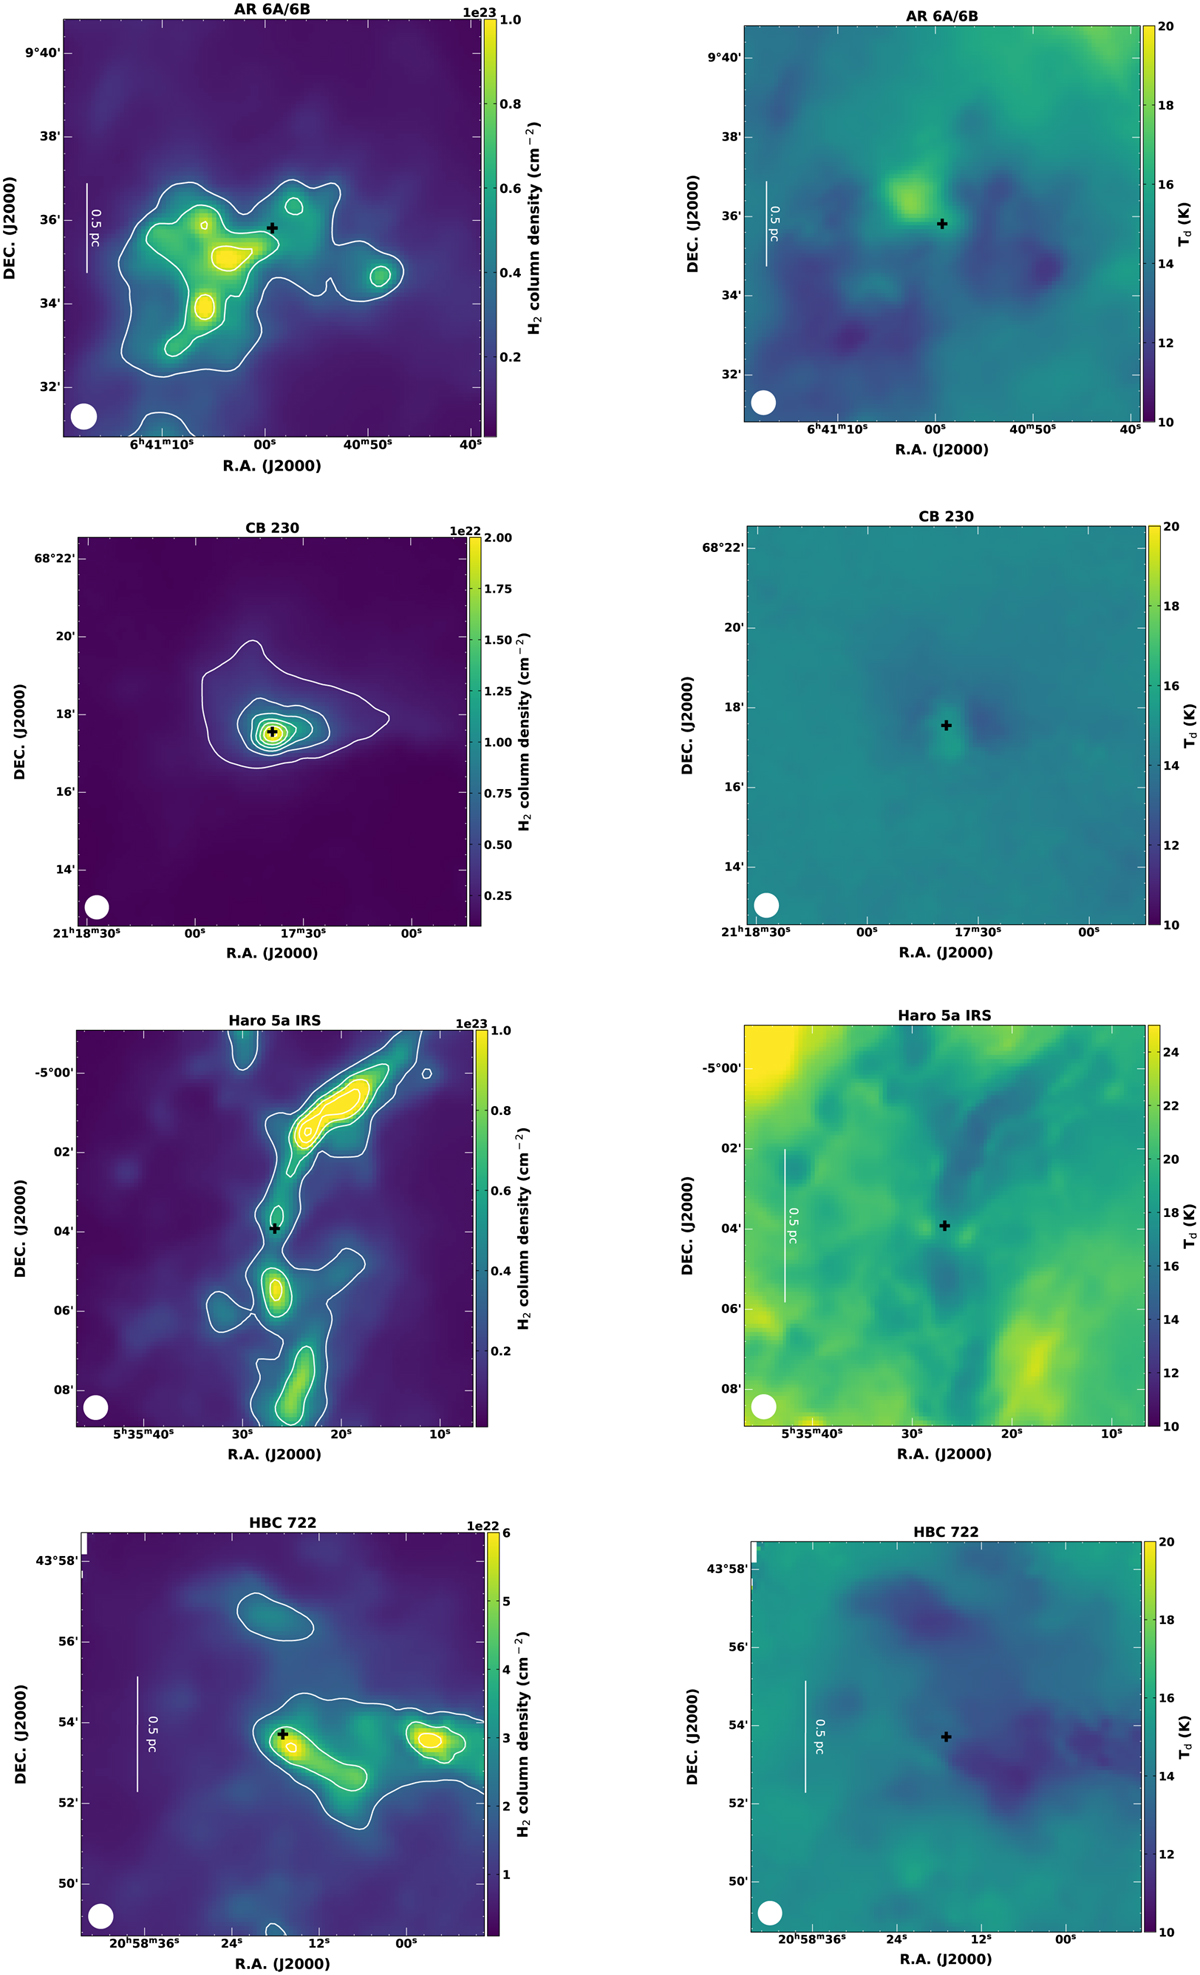
Download original image
H2 column density (left) and dust temperature (right) maps derived from the pixel-by-pixel SED fitting of the Herschel data, convolved to the Effelsberg beam (shown in the bottom left corner). The field of view is the same for all sources, corresponding to 10′ × 10′, and + symbols represent the pointing positions listed in Tables 1, 2 and B.1, respectively. The physical scale is presented for sources with known distances, taken from the study of Audard et al. (2014) or described in the notes of Table B.1. The colour scale is not the same for all sources.
Current usage metrics show cumulative count of Article Views (full-text article views including HTML views, PDF and ePub downloads, according to the available data) and Abstracts Views on Vision4Press platform.
Data correspond to usage on the plateform after 2015. The current usage metrics is available 48-96 hours after online publication and is updated daily on week days.
Initial download of the metrics may take a while.