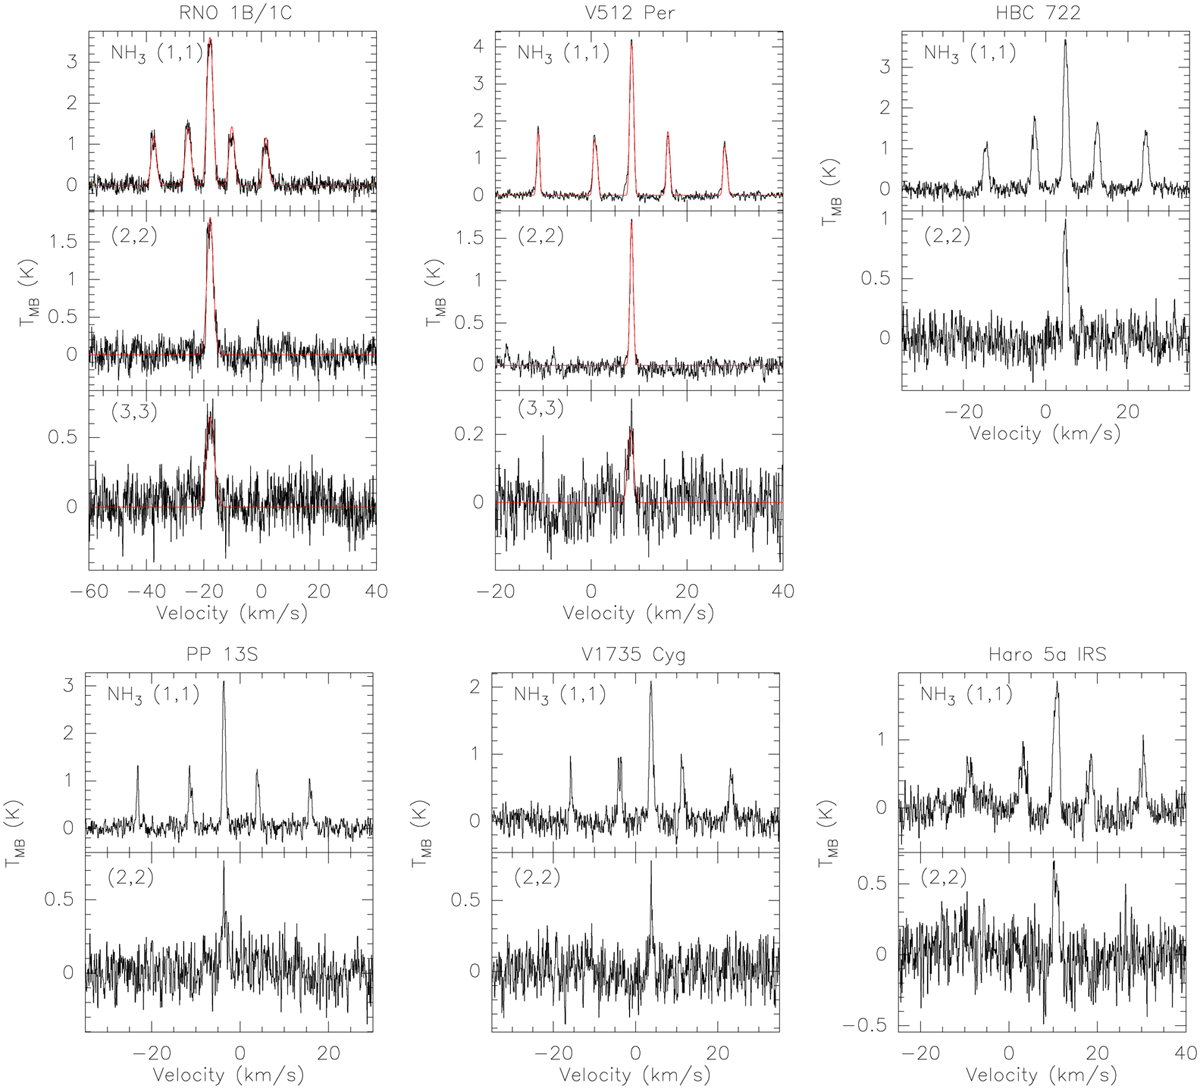
Fig. 1
Download original image
Examples of reduced and calibrated spectra for the NH3 (1, 1), (2, 2) and (3, 3) transitions. The transition is indicated in the upper left corner of each panel. For the first two sources the fits are shown in red. The (3, 3) transition was detected only towards RNO 1B/1C and V512 Per (SVS 13A). The full version of the figure and the FITS files for the NH3 detections are available at https://zenodo.org/record/7736131
Current usage metrics show cumulative count of Article Views (full-text article views including HTML views, PDF and ePub downloads, according to the available data) and Abstracts Views on Vision4Press platform.
Data correspond to usage on the plateform after 2015. The current usage metrics is available 48-96 hours after online publication and is updated daily on week days.
Initial download of the metrics may take a while.