Fig. 7.
Download original image
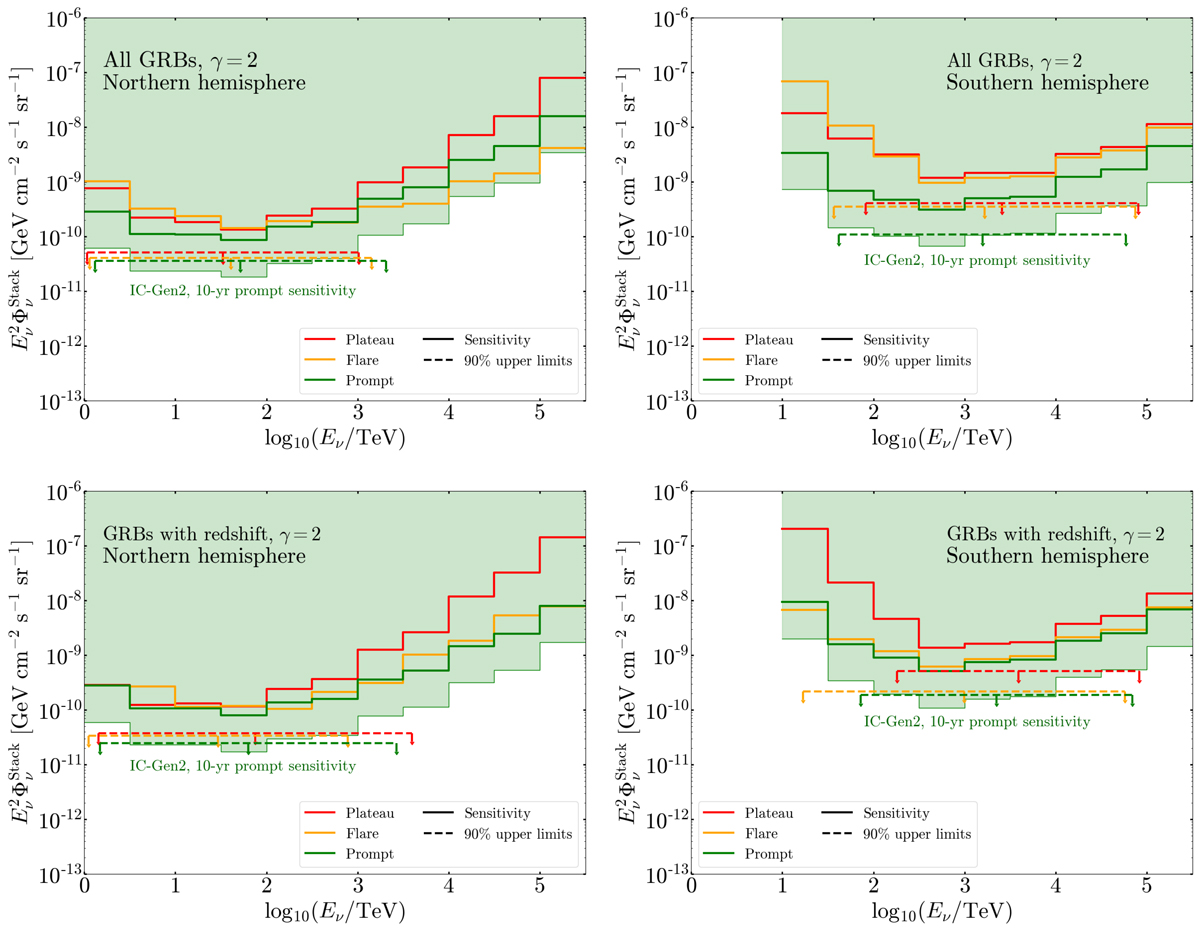
Differential sensitivity (solid lines) and 90% CL upper limits (dashed lines) for the stacking analysis of the plateau (red), flare (yellow), and prompt (green) catalog, assuming γ = 2. Curves are shown for the Northern (left) and Southern (right) Hemisphere, and for catalogs comprising all the GRBs (first row) or the subcatalogs of GRBs with measured redshift (second row). As a comparison, the shaded green region shows the 10-yr differential sensitivity calculated for IceCube-Gen2 (Clark 2021) as explained in the text.
Current usage metrics show cumulative count of Article Views (full-text article views including HTML views, PDF and ePub downloads, according to the available data) and Abstracts Views on Vision4Press platform.
Data correspond to usage on the plateform after 2015. The current usage metrics is available 48-96 hours after online publication and is updated daily on week days.
Initial download of the metrics may take a while.