Fig. 6.
Download original image
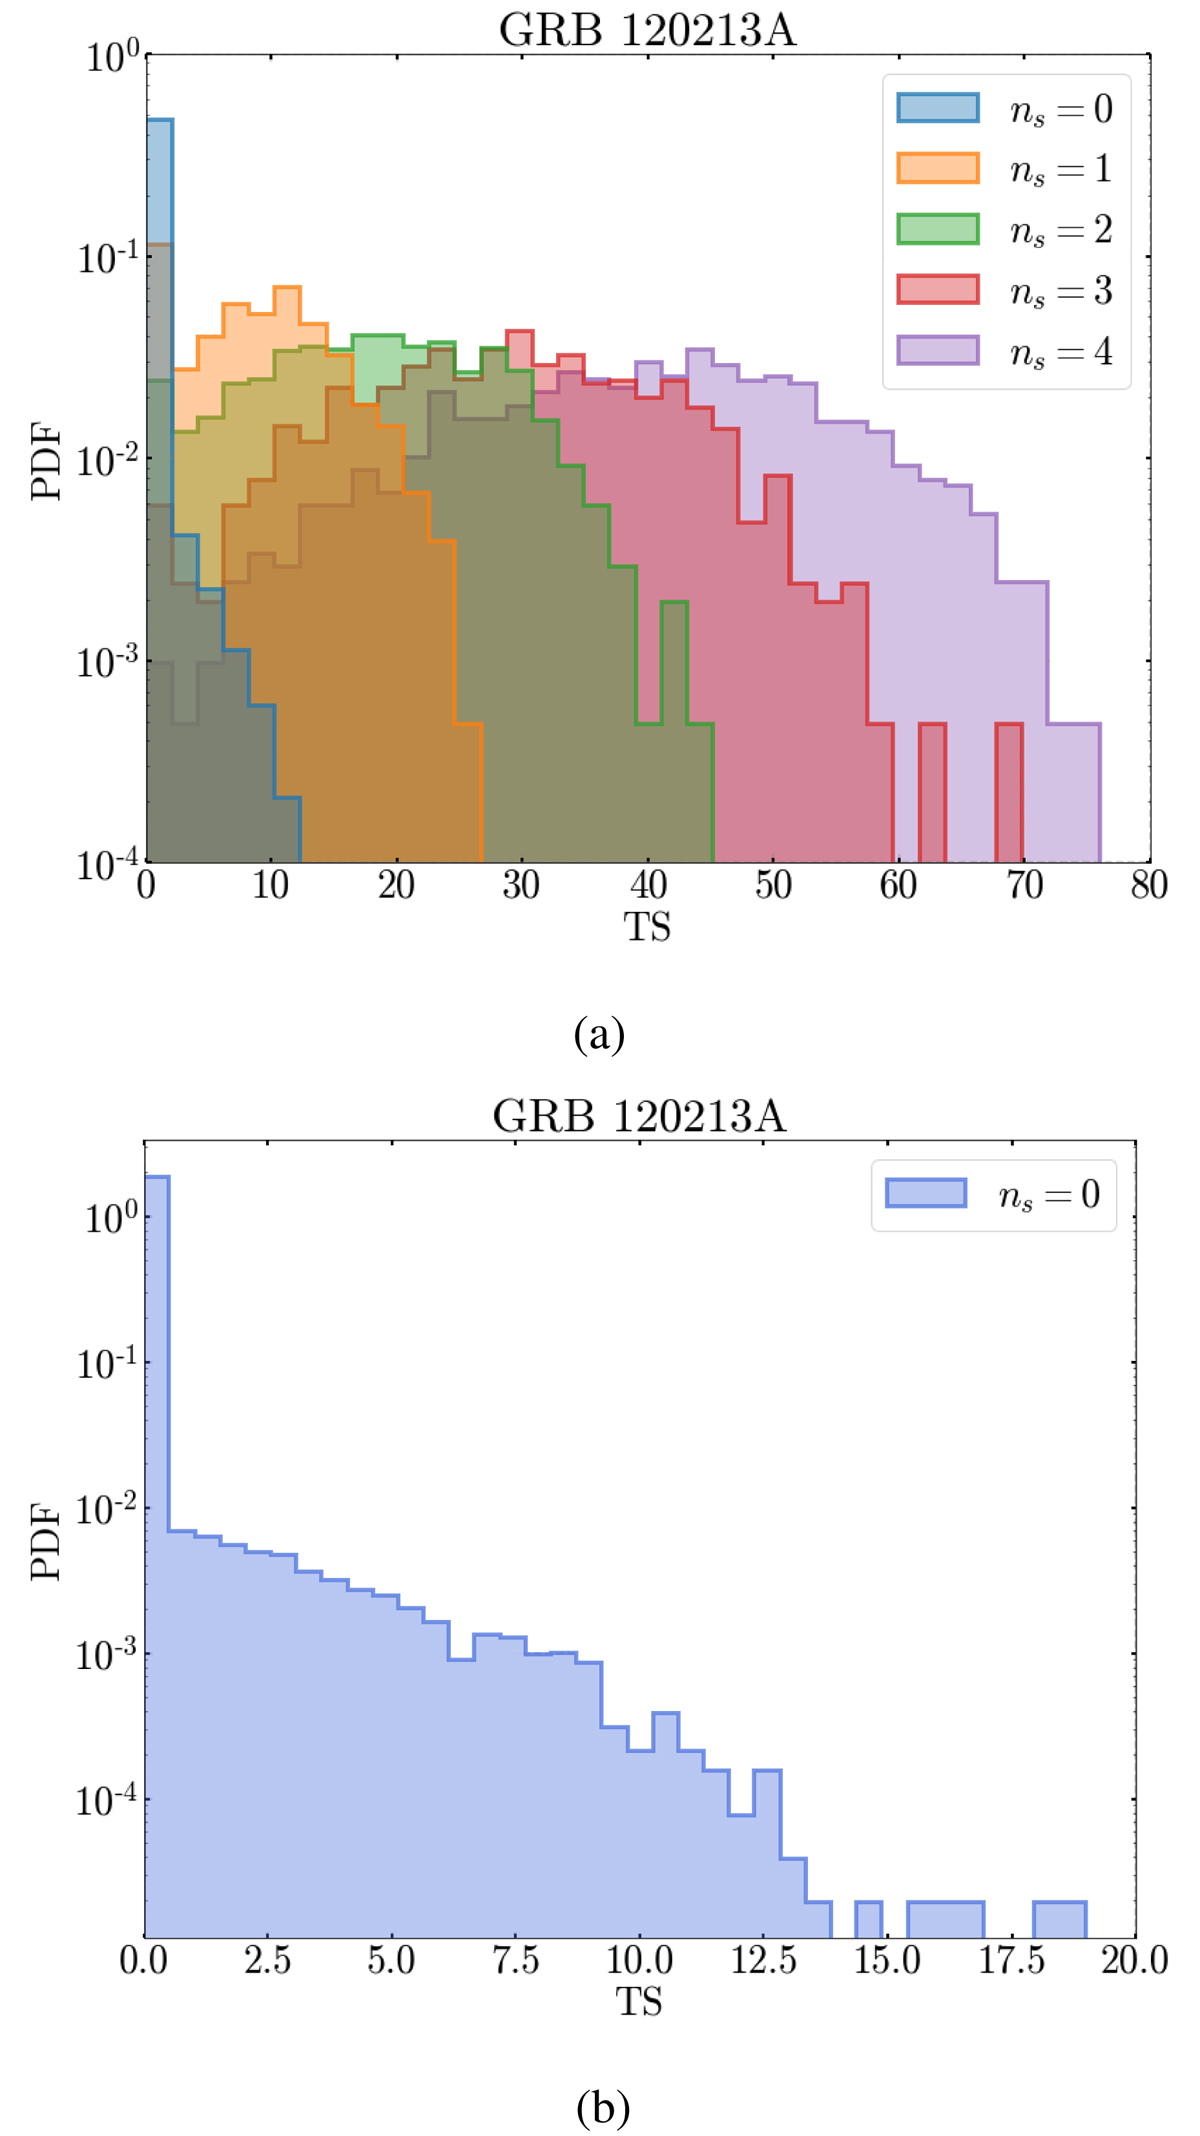
(a) Example of TS distributions for the background (injected ns = 0, with 100 000 generated pseudo-experiments) and various signal hypotheses (injected ns > 1, with 10 000 pseudo-experiments each) at the location of GRB 120213A, for the single-source search of the flare catalog and assuming spectral index γ = 2. The signal distributions are very different from the background distribution already for ns = 1, suggesting that few signal events can lead to a high pretrial significance. (b) Background TS distribution, the same as in (a), but with different binning and axis ranges. The bin at TS = 0 corresponds to under-fluctuations: for this GRB, about 96% of the background pseudo-experiments result in under-fluctuations.
Current usage metrics show cumulative count of Article Views (full-text article views including HTML views, PDF and ePub downloads, according to the available data) and Abstracts Views on Vision4Press platform.
Data correspond to usage on the plateform after 2015. The current usage metrics is available 48-96 hours after online publication and is updated daily on week days.
Initial download of the metrics may take a while.