Fig. C.1
Download original image
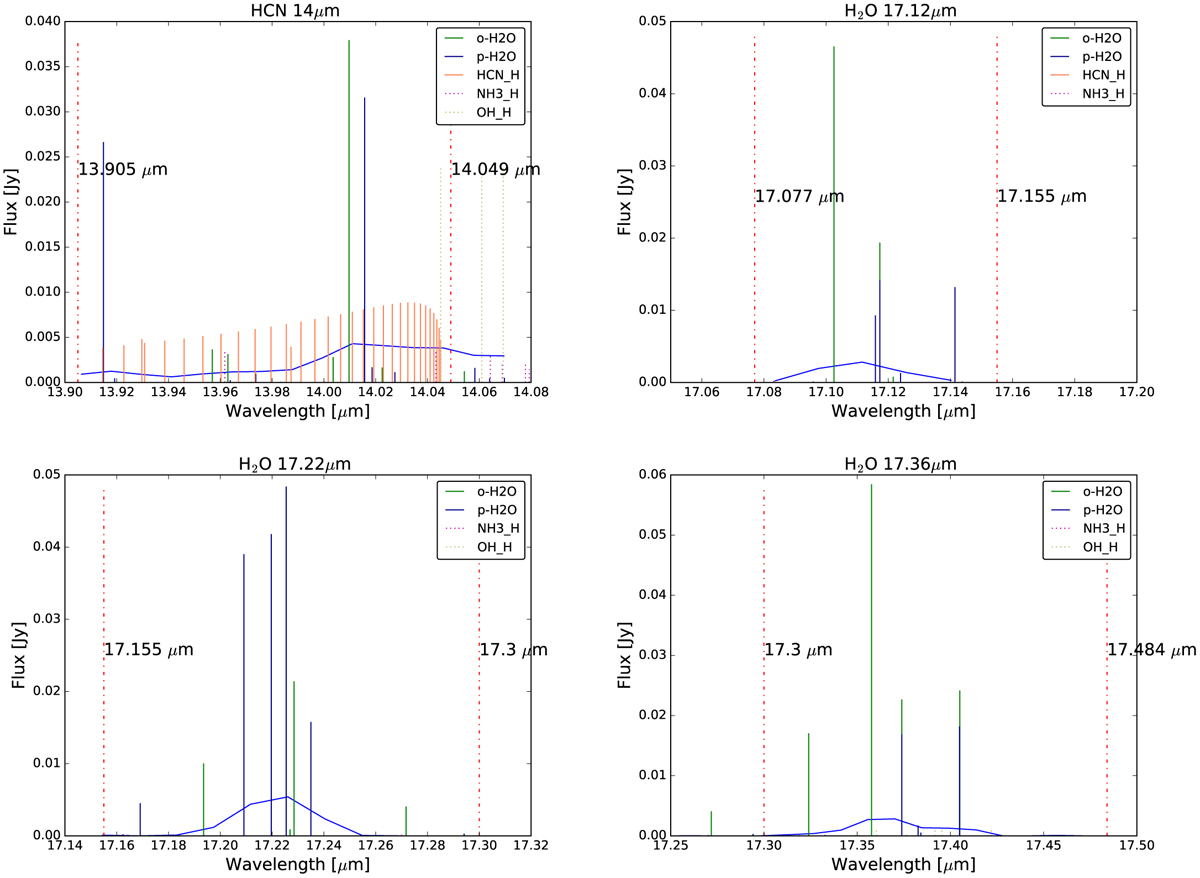
Top left plot, Spitzer 1RS regime for the 14 µm HCN blend. Top right, same plot for H2O in the 17.12 µm regime. Bottom left, same plot for H2O in the 17.22 µm regime. Bottom right, H2O in the 17.36 µm regime. Each transition in the regime is plotted as a dark blue or green line (ortho and para H2O), red blend for HCN ro-vibrational (LTE treatment, HITRAN database (★), dotted magenta line for NH3 rovibrational (LTE treatment, HITRAN database(★), dotted khaki for OH (LTE treatment, HITRAN database(★). The blue solid curve represents the final blended 1RS spectrum (R = 600). Vertical dot-dashed lines delimit the range over which the blend flux is taken in Najita et al. (2013).
Current usage metrics show cumulative count of Article Views (full-text article views including HTML views, PDF and ePub downloads, according to the available data) and Abstracts Views on Vision4Press platform.
Data correspond to usage on the plateform after 2015. The current usage metrics is available 48-96 hours after online publication and is updated daily on week days.
Initial download of the metrics may take a while.