Fig. 3
Download original image
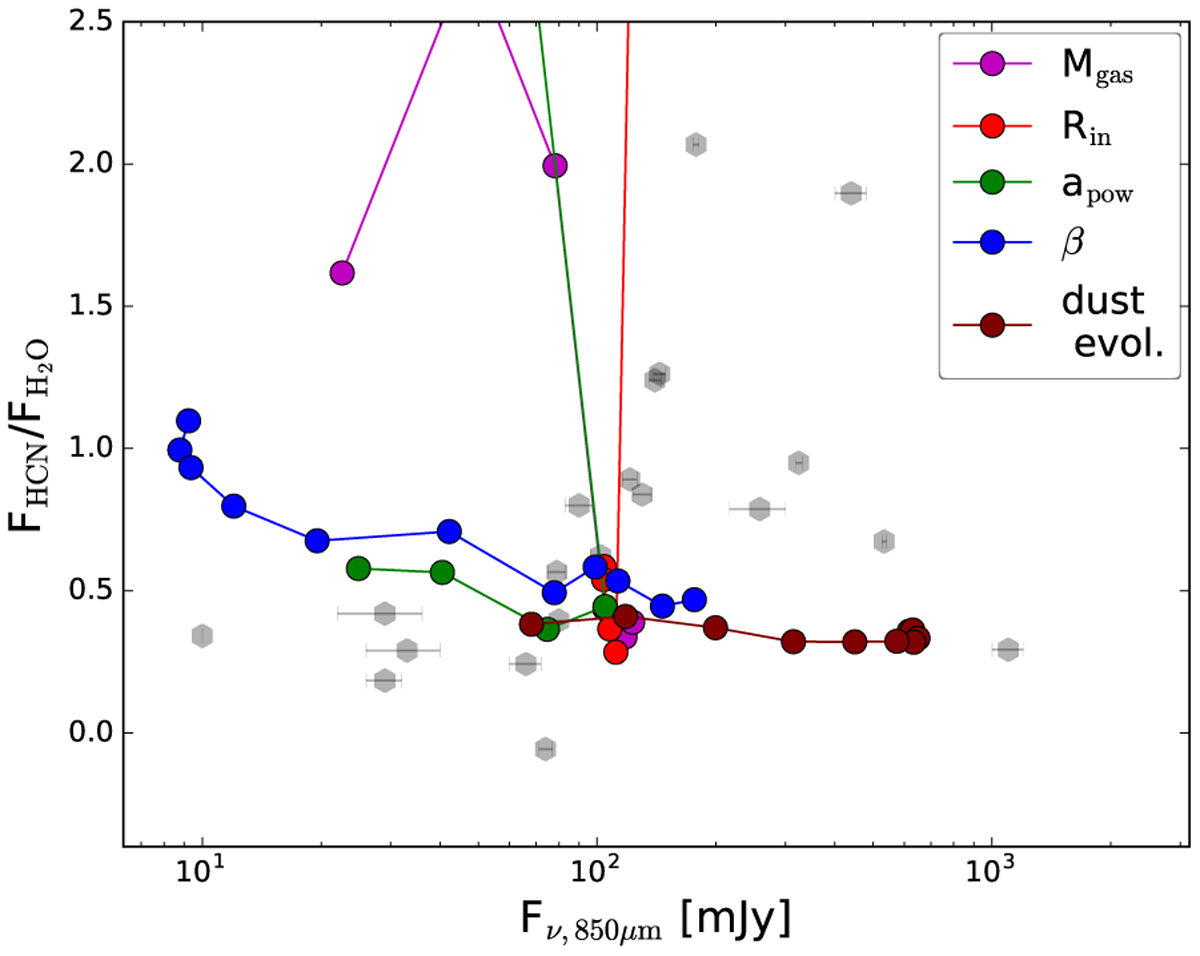
HCN/H2O MIR blend flux ratios versus 850 µm continuum flux from Andrews & Williams (2005), with indicated error bars. Observations and data collected for the objects (grey hexagons) are compared with the same quantities computed for our model series: disk gas mass Mgas (magenta), inner disk radius Rin (red), power law index of the grain size distribution apow (green), flaring angle β (blue), and dust evolution models (brown; symbols are the same as in previous figures). The red and green series extend beyond the shown range and include apow > 3.5 and Rin > 5 au.
Current usage metrics show cumulative count of Article Views (full-text article views including HTML views, PDF and ePub downloads, according to the available data) and Abstracts Views on Vision4Press platform.
Data correspond to usage on the plateform after 2015. The current usage metrics is available 48-96 hours after online publication and is updated daily on week days.
Initial download of the metrics may take a while.