Fig. 2
Download original image
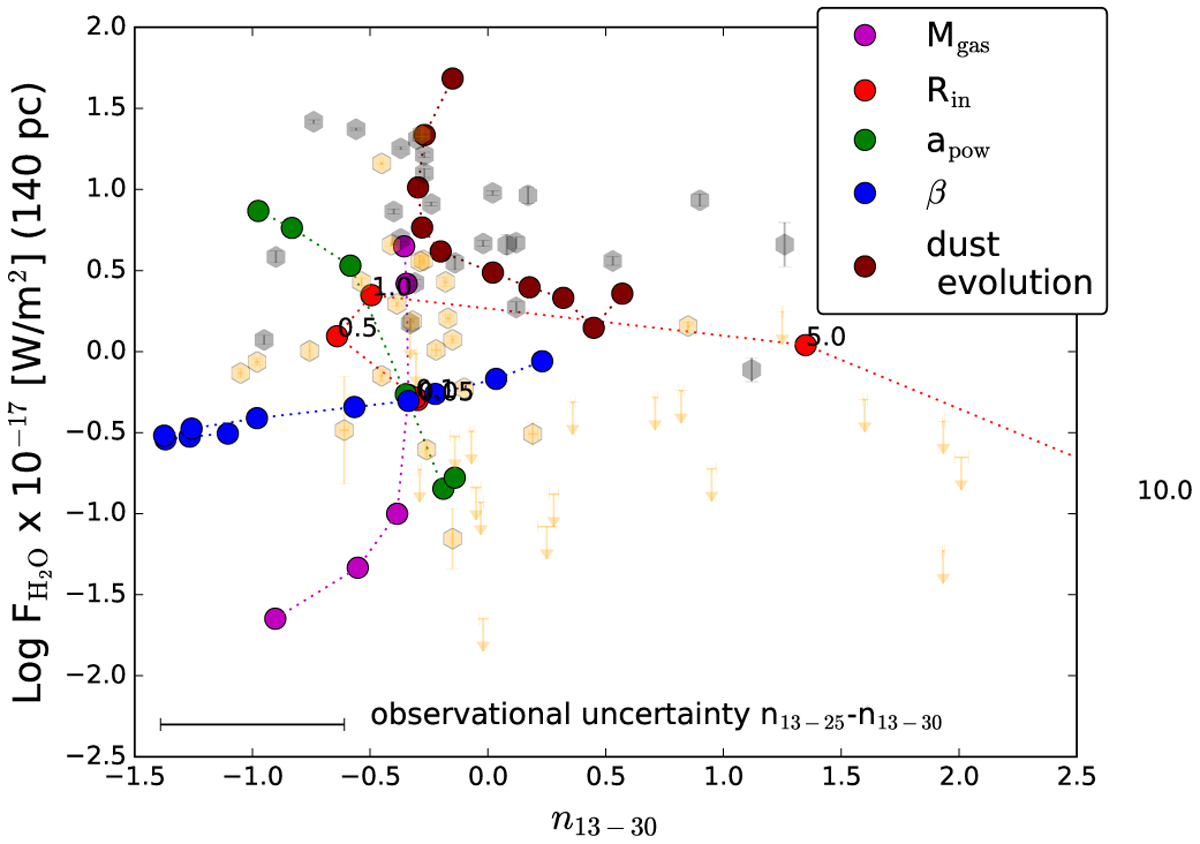
H2O MIR fluxes versus n13–30 from Salyk et al. (2011; orange hexagons) and n13–25 from Najita et al. (2013; grey hexagons) scaled to 140 pc (Distances are taken from https://gea.esac.esa.int/archive/) with error bars in grey. The model series for disk gas mass (purple circles), disk inner radius (red circles), dust power law index (green circles), disk flaring index (blue circles) from Antonellini et al. (2015, 2016), and dust evolution from Greenwood et al. (2019a, 0.018 Myr, 0.032 Myr, 0.056 Myr, 0.1 Myr, 0.18 Myr, 0.32 Myr, 0.56 Myr, 1.0 Myr, 1.8 Myr, 3.2 Myr, brown circles) are over-plotted. Bottom error bar shows the average difference detected between the three targets for which continuum indexes at 13–30 and 13–25 were available.
Current usage metrics show cumulative count of Article Views (full-text article views including HTML views, PDF and ePub downloads, according to the available data) and Abstracts Views on Vision4Press platform.
Data correspond to usage on the plateform after 2015. The current usage metrics is available 48-96 hours after online publication and is updated daily on week days.
Initial download of the metrics may take a while.