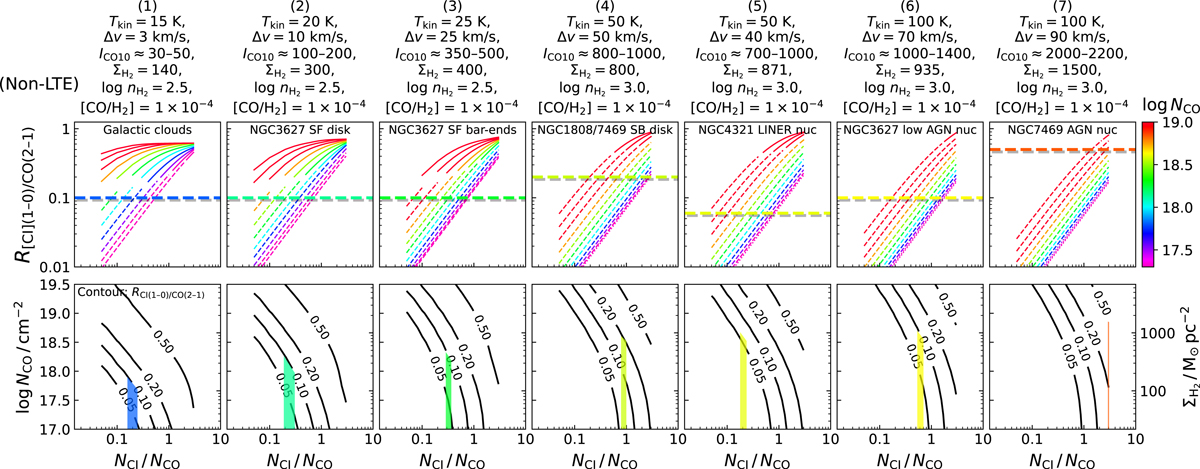
Fig. 9.
Download original image
Observed and calculated RC I/CO as a function of CO column density NCO and [C I/CO] abundance (column density) ratio NC I/NCO for seven representative ISM conditions, similar to Fig. 8 but based on non-LTE calculations. Upper panels: line ratio RC I/CO versus the abundance ratio NC I/NCO for different NCO, as indicated by the color. Dashed, dotted and solid lines are for different CO(2−1) [C I](1−0) optical depths as described in Fig. 8 caption. Horizontal thick line is the observed RC I/CO value. Lower panels: are the contours of RC I/CO = 0.05, 0.10, 0.20, and 0.50 in the CO column density versus C I/CO abundance ratio plane. Vertical color shading indicates the final abundance ratio NC I/NCO that can match both the observed RC I/CO and the assumed Σmol value noted at the top of each panel.
Current usage metrics show cumulative count of Article Views (full-text article views including HTML views, PDF and ePub downloads, according to the available data) and Abstracts Views on Vision4Press platform.
Data correspond to usage on the plateform after 2015. The current usage metrics is available 48-96 hours after online publication and is updated daily on week days.
Initial download of the metrics may take a while.