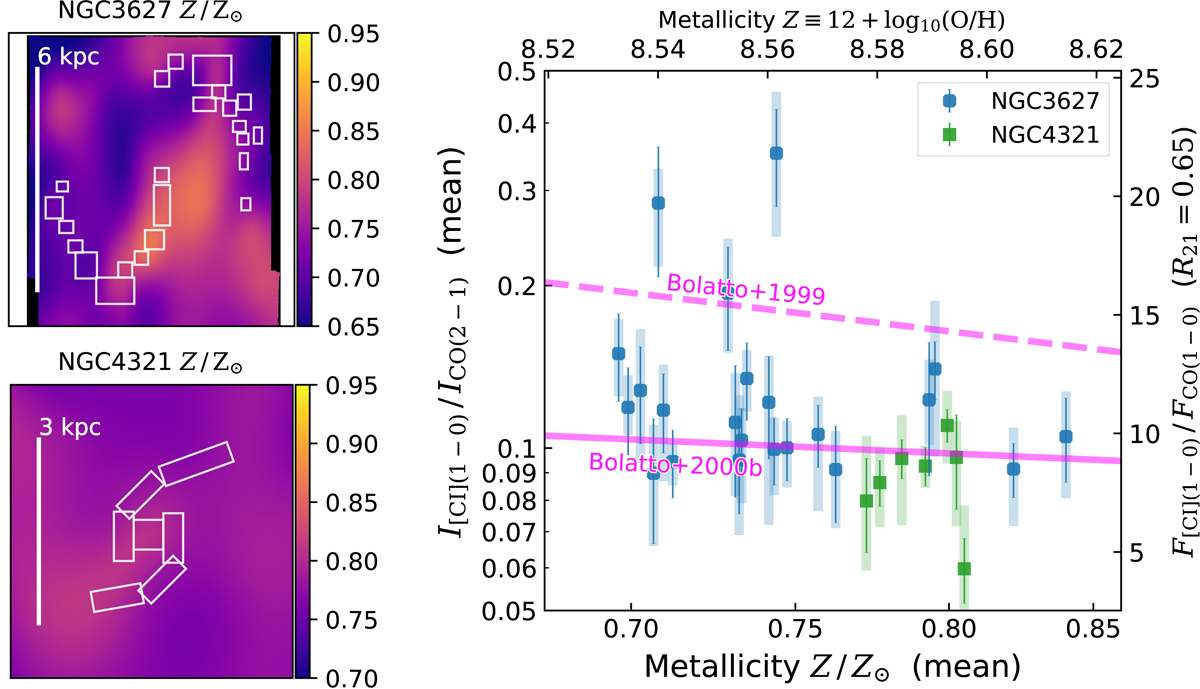
Fig. 7.
Download original image
Line ratio versus metallicity. Left two panels: metallicity maps of NGC 3627 and NGC 4321 from Williams et al. (2022) based on PHANGS-MUSE (Emsellem et al. 2022) data. Boxes are regions as defined in Figs. 1 and 2. Right panel: RC I/CO versus metallicity scatter plot for regions in NGC 3627 and NGC 4321. The bottom axis represents the metallicity in solar units, top axis is the metallicity in 12 + log(O/H), left-axis is the line ratio of [C I](1−0) and CO(2−1) in K km s−1 units, and right-axis is the ratio of fluxes in erg s−1 cm−2 sr−1 units. The left and right axes are matched by a factor of (ν[C I]1−0/νCO1−0)3 × R21, where we adopt R21 = 0.65 (Leroy et al. 2022). Data points are the mean metallicity and RC I/CO in each region shown in left panels, with error bars indicating the typical uncertainty in RC I/CO, and vertical color shading indicating the 16th to 84th percentiles of the pixels’ RC I/CO distribution inside each region. The Bolatto et al. (2000a) empirical fitting and Bolatto et al. (1999) model prediction lines are overlaid. The three outliers in NGC 3627 with RC I/CO ∼ 0.19, 0.28, and 0.35 are regions 20, 21, and 22, respectively. The outlier point in NGC 4321 with RC I/CO ∼ 0.06 is its center is region 1.
Current usage metrics show cumulative count of Article Views (full-text article views including HTML views, PDF and ePub downloads, according to the available data) and Abstracts Views on Vision4Press platform.
Data correspond to usage on the plateform after 2015. The current usage metrics is available 48-96 hours after online publication and is updated daily on week days.
Initial download of the metrics may take a while.