Fig. 6.

Download original image
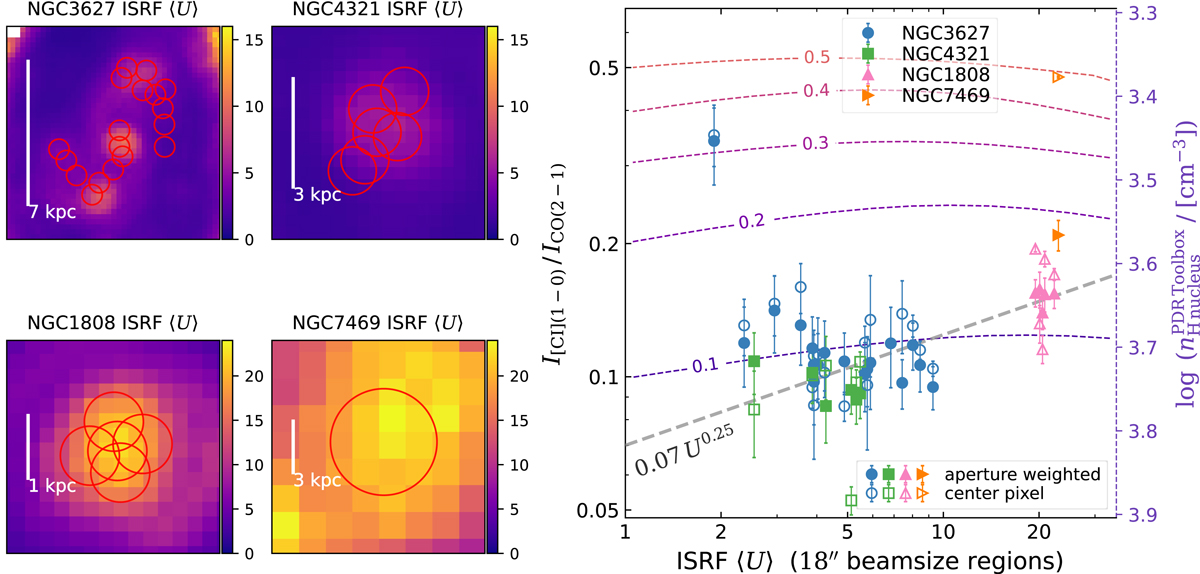
Line ratio versus mean ISRF intensity ⟨U⟩ measured from SED fitting to the near- to far-IR (Spitzer, Herschel) data. Left four panels: ⟨U⟩ maps of NGC 3627, NGC 4321, NGC 1808 and NGC 7469, and as described in Sect. 3.3 are obtained from the works done by Chastenet et al. (in prep.) as a continued effort of Chastenet et al. (2021). Right panel: scatter plot of RC I/CO versus ⟨U⟩ at a spatial resolution of ∼18″ in the manually-selected apertures shown in the left panels. We computed a beam-weighted mean RC I/CO and a center pixel RC I/CO for each aperture, displayed as the solid and open symbols, respectively. Error bars are the corresponding beam-weighted mean or central pixel RC I/CO uncertainties in each region. The region diameter (∼18″) corresponds to the coarsest resolution of the Herschel data used in the SED fitting. The gray dotted line shows RC I/CO = 0.07 U0.25 as a guiding line. The colored dotted contours (labeled 0.1−0.5) are the model contours of RC I/CO computed from the PDR Toolbox (using the latest wk2020 model and solar metallicity; Kaufman et al. 2006). We convert G0 from the model contour to the x-axis U by multiplying with a factor of 0.88 (Draine et al. 2007). The right y-axis indicates the PDR model’s nH2, whose range is manually adjusted so that the model contours roughly match the left x-axis. The PDR model contours show little dependence of RC I/CO on U in the horizontal direction but a strong correlation with nH2 as seen by the vertical gradient.
Current usage metrics show cumulative count of Article Views (full-text article views including HTML views, PDF and ePub downloads, according to the available data) and Abstracts Views on Vision4Press platform.
Data correspond to usage on the plateform after 2015. The current usage metrics is available 48-96 hours after online publication and is updated daily on week days.
Initial download of the metrics may take a while.


