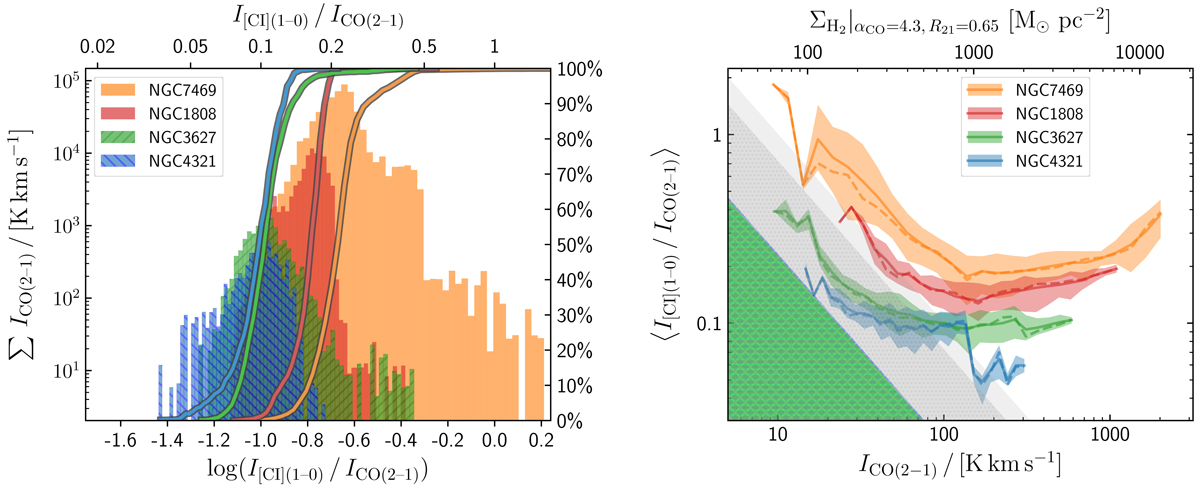
Fig. 5.
Download original image
Line flux ratio distributions. Left panel: histograms of the sum of CO(2−1) surface brightness over pixels in each C I/CO line ratio interval in the four galaxies. The bold curves are the cumulative distributions of the corresponding histograms. Right panel: mean C I/CO line ratio for pixels in each bin of CO(2−1) surface brightness (or molecular gas surface density as indicated by the top-axis assuming a constant αCO = 4.3 and R21 = 0.65). Shaded area enveloping each mean trend indicates the 16th to 84th percentiles in each bin, and dashed line indicates the 50th percentile. This panel thus more clearly illustrates the ridge and scatter of the trends in the right panel of Fig. 4. Detection limits are shown consistently with Fig. 4.
Current usage metrics show cumulative count of Article Views (full-text article views including HTML views, PDF and ePub downloads, according to the available data) and Abstracts Views on Vision4Press platform.
Data correspond to usage on the plateform after 2015. The current usage metrics is available 48-96 hours after online publication and is updated daily on week days.
Initial download of the metrics may take a while.