Fig. 4.
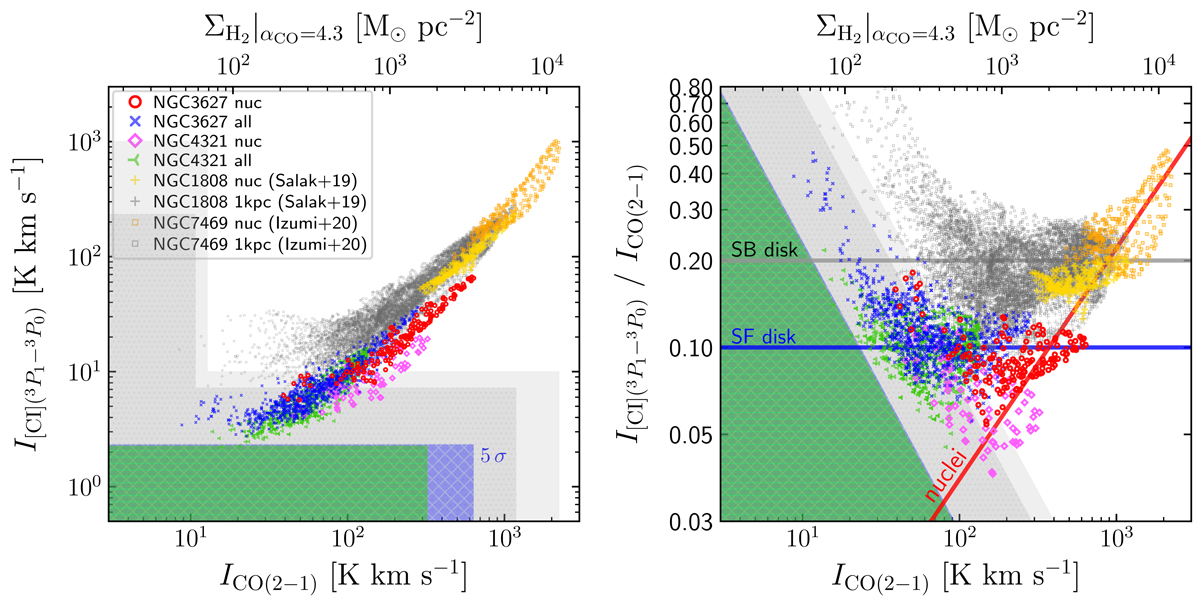
Download original image
Line flux and ratio correlations. Left: I[C I](1−0) versus ICO(2 − 1) in the four galaxies we studied: NGC 3627, NGC 4321, NGC 1808 and NGC 7469. The I[C I](1−0) and ICO(2 − 1) integrated fluxes are moment-0 intensities extracted from their beam and pixel size matched data cubes. Only data points with propagated moment-0 S/N ≥ 5 are shown. The blue (with crossed hatch), green (with horizontal line hatch), gray (with dotted hatch) and light gray shadings indicate the 5σ thresholds for the four galaxies, respectively. Typical line widths of 10 km s−1 (NGC 3627 and NGC 4321) and 30 km s−1 (NGC 1808 and NGC 7469) in sigma are used to calculate the thresholds together with the channel rms in Table 1. For NGC 3627 and NGC 4321, their (uv-matched) CO(2−1) 5σ thresholds are out of the plotting range. Top axis shows the simply-converted H2 surface density using a constant αCO = 4.3 and CO excitation (i.e., CO(2−1) to CO(1−0) line ratio) R21 = 0.65. Right: same data but shown as the line ratio RC I/CO = I[C I](1−0)/ICO(2−1) versus ICO(2 − 1). The blue horizontal line indicates a star-forming (SF) disk-like RC I/CO ∼ 0.1, i.e., the spiral arms of NGC 3627 and NGC 4321. The gray horizontal line indicates a starburst (SB) disk-like RC I/CO ∼ 0.2, i.e., the ∼1 kpc SB disk/ring in NGC 1808 and NGC 7469. The red line with a slope of 0.8 in logarithm (0.035 (ICO(2 − 1)/[100 K km s−1])0.8) visually guides the trend of increasing RC I/CO in the central regions of these galaxies (see boxes in Figs. 1–3, sizes ∼300 − 500 pc).
Current usage metrics show cumulative count of Article Views (full-text article views including HTML views, PDF and ePub downloads, according to the available data) and Abstracts Views on Vision4Press platform.
Data correspond to usage on the plateform after 2015. The current usage metrics is available 48-96 hours after online publication and is updated daily on week days.
Initial download of the metrics may take a while.