Fig. 3.
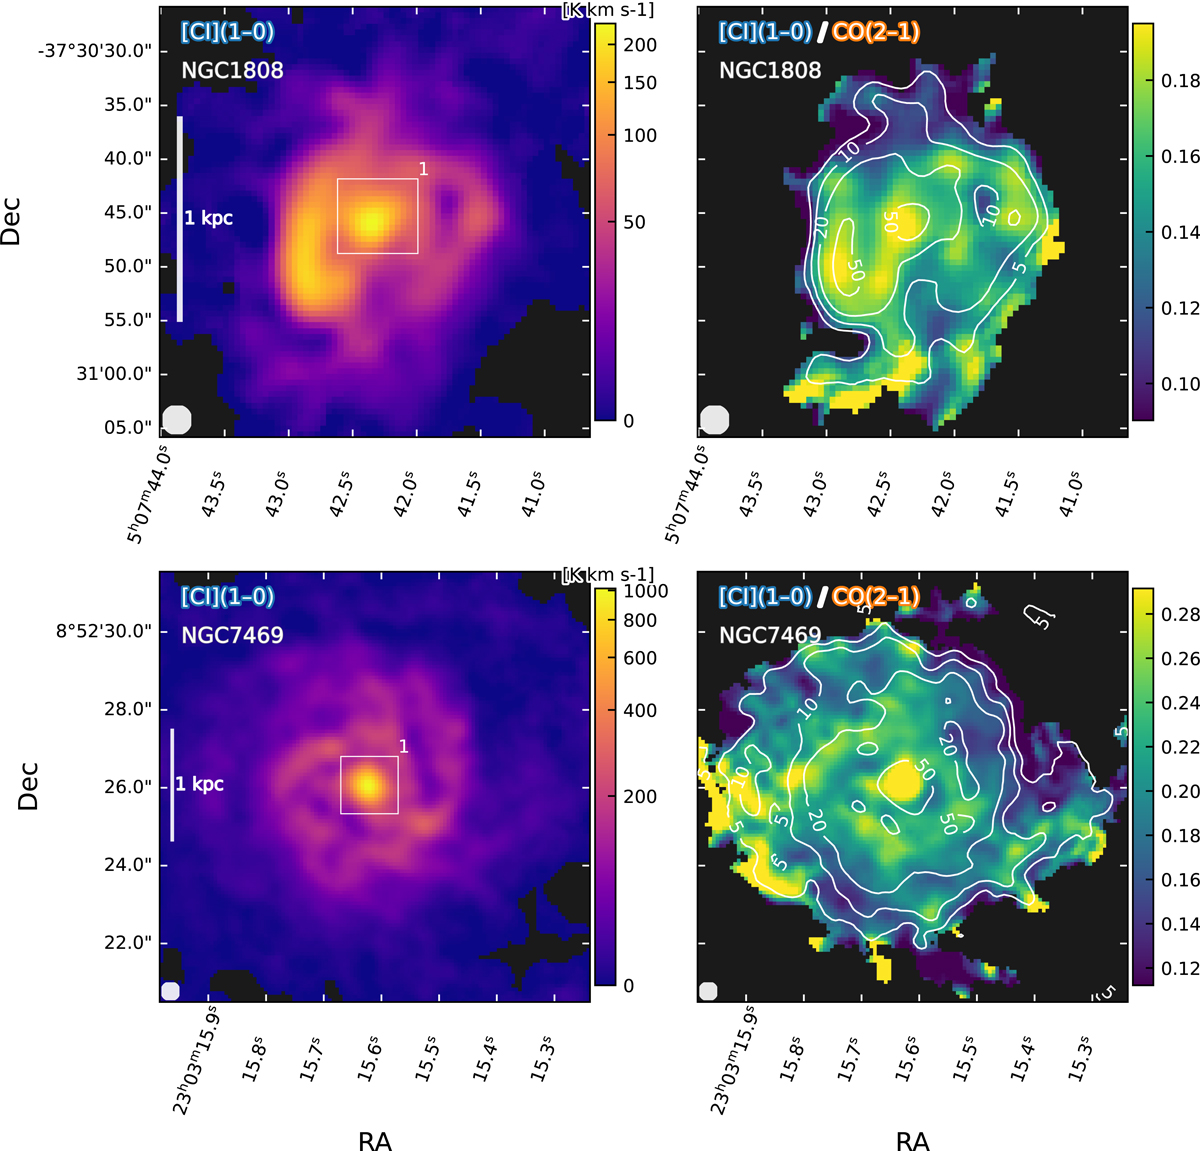
Download original image
[C I](1−0) (left) and RC I/CO (right) maps of NGC 1808 in the upper panels and NGC 7469 in the lower panels. Similar to Figs. 1 and 2, the line intensity maps are defined in the broad mask and the RC I/CO maps are restricted to the combined signal mask. Boxes in the left panels indicate the manually selected central regions where the pixels are highlighted in Fig. 4. Contours in the right panels indicate the 5, 10, 20 and 50-σ levels of the left-panel C I intensity maps.
Current usage metrics show cumulative count of Article Views (full-text article views including HTML views, PDF and ePub downloads, according to the available data) and Abstracts Views on Vision4Press platform.
Data correspond to usage on the plateform after 2015. The current usage metrics is available 48-96 hours after online publication and is updated daily on week days.
Initial download of the metrics may take a while.