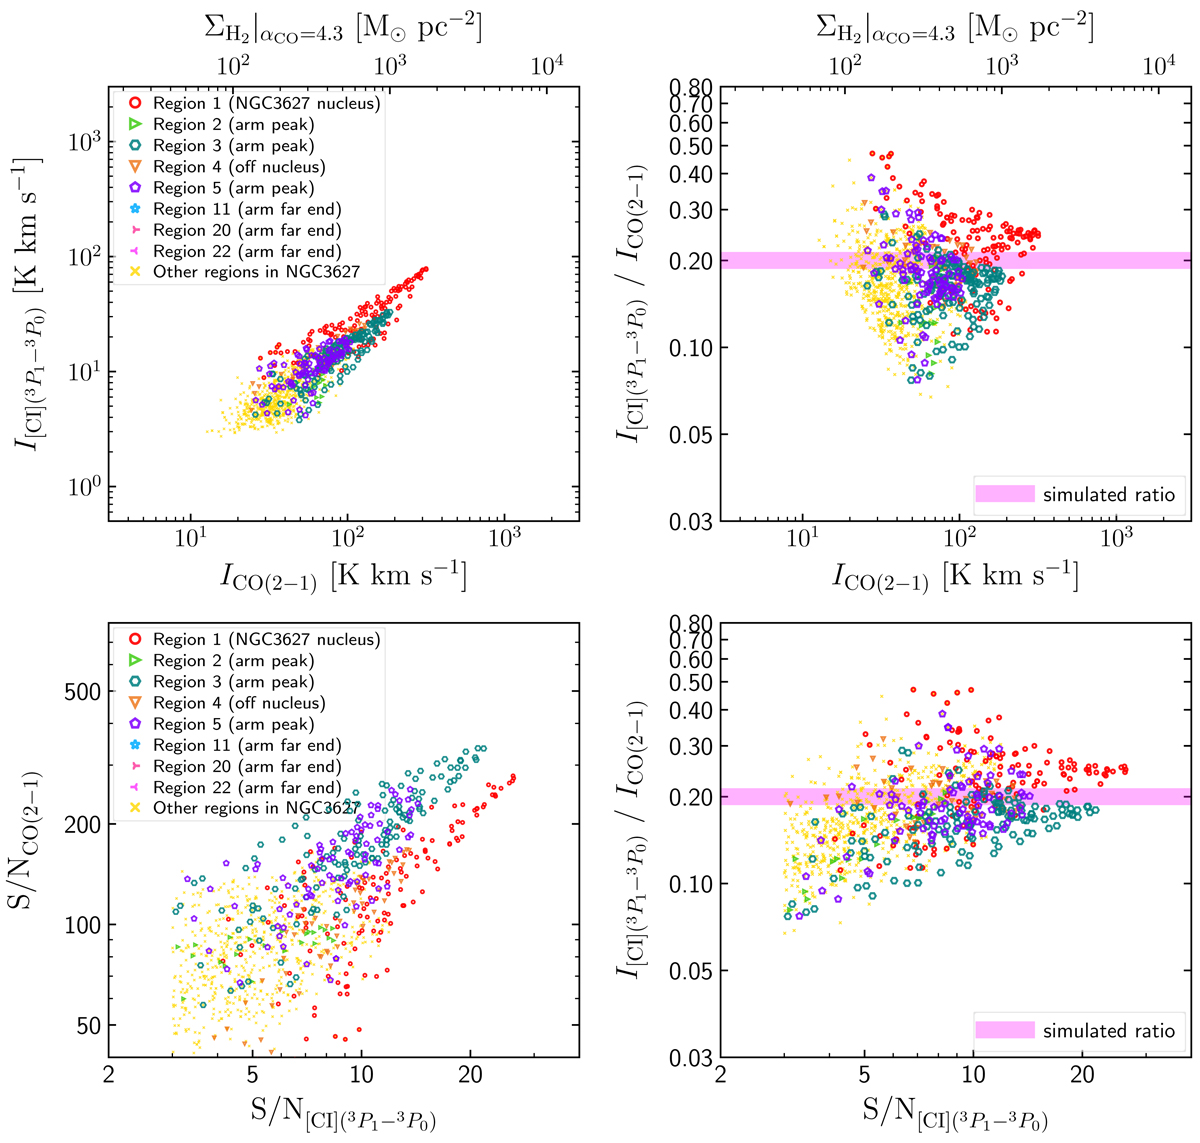
Fig. C.1.
Download original image
Line flux, ratio and S/N correlations from our CASA simulation. Upper panels: [C I](1−0) and CO(2−1) line brightness and ratio similar to Fig. 4, but from our simulation (with a constant input RC I/CO = 0.2 as indicated by the horizontal shading in the right panels). Lower panels: Similar to the upper panels but showing line S/N instead of brightness. This illustrates how RC I/CO can be biased in low-S/N situation.
Current usage metrics show cumulative count of Article Views (full-text article views including HTML views, PDF and ePub downloads, according to the available data) and Abstracts Views on Vision4Press platform.
Data correspond to usage on the plateform after 2015. The current usage metrics is available 48-96 hours after online publication and is updated daily on week days.
Initial download of the metrics may take a while.