Fig. B.1.
Download original image
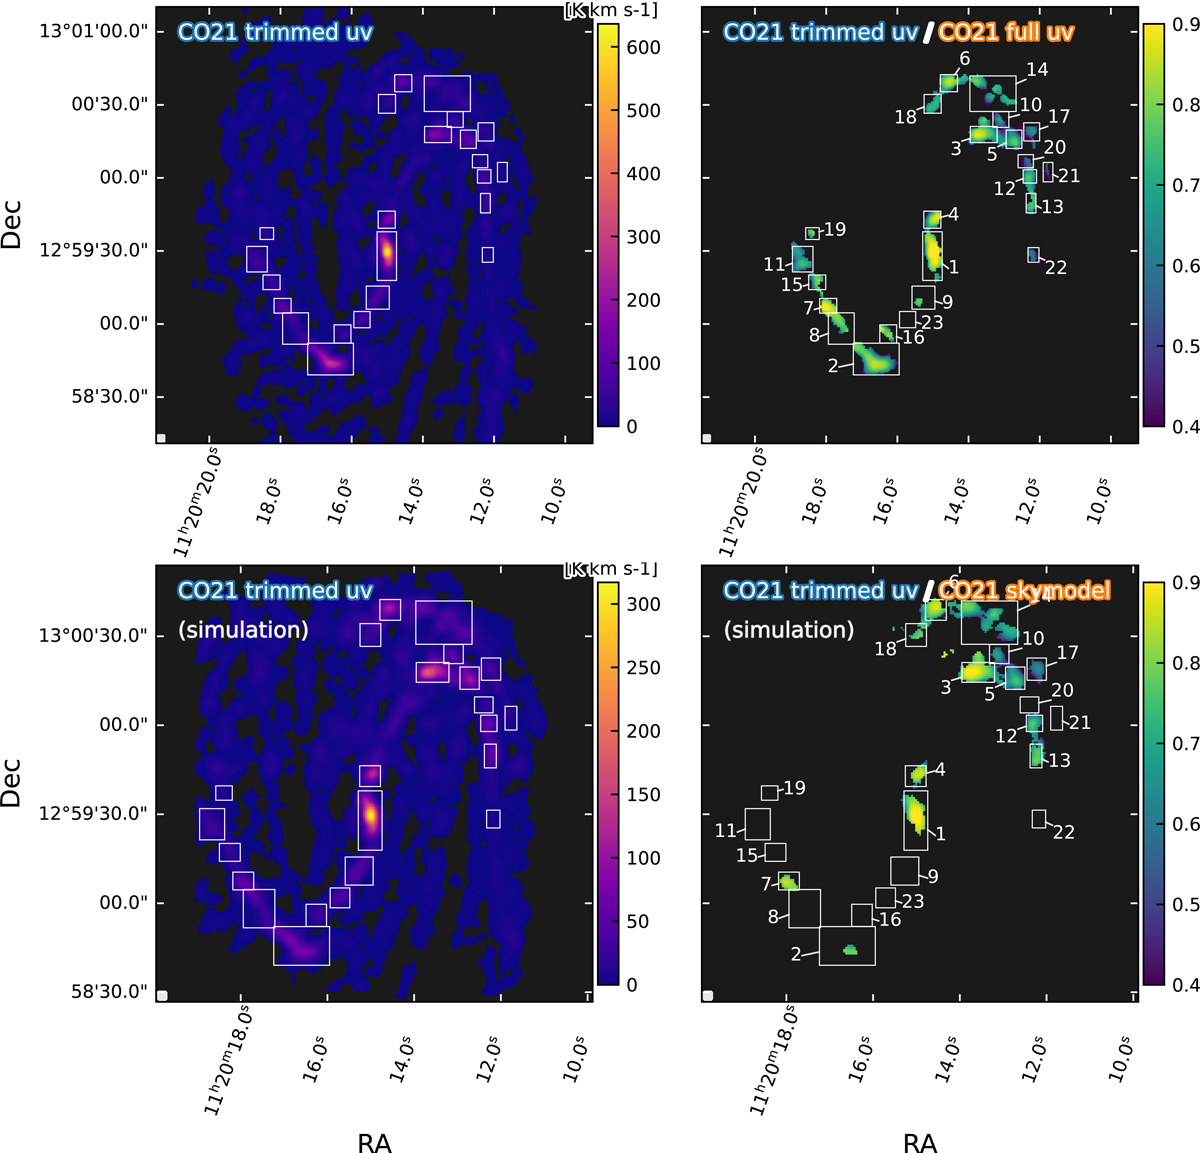
CO(2−1) line flux and fraction of missing flux maps. Upper left panel: Short-spacing corrected (12m+7m+tp) PHANGS-ALMA CO(2-1) derived moment-0 map. Upper right panel: Ratio map of the uv-trimmed CO(2-1) moment-0 map used in this work to that in the left panel. Lower left panel: CO(2-1) moment-0 map derived from our simulation with uv trimming as for real data. Lower right panel: ratio map of the uv-trimmed CO(2-1) moment-0 map based on the simulation to the “true” skymodel moment-0 map as shown left. All moment maps are derived by first convolving cubes to our working resolution of 3.46″ then performing masking analysis as described in Appendix A, except for the “true” skymodel moment-0 map which is computed without any masking. We note that in the simulation-based analysis, some regions have too low S/N due to their faint CO brightness or insufficient cleaning, thus they are out of the mask and show blank line ratios (instead of very low missing flux) in the lower right-hand panel.
Current usage metrics show cumulative count of Article Views (full-text article views including HTML views, PDF and ePub downloads, according to the available data) and Abstracts Views on Vision4Press platform.
Data correspond to usage on the plateform after 2015. The current usage metrics is available 48-96 hours after online publication and is updated daily on week days.
Initial download of the metrics may take a while.