Fig. 1.
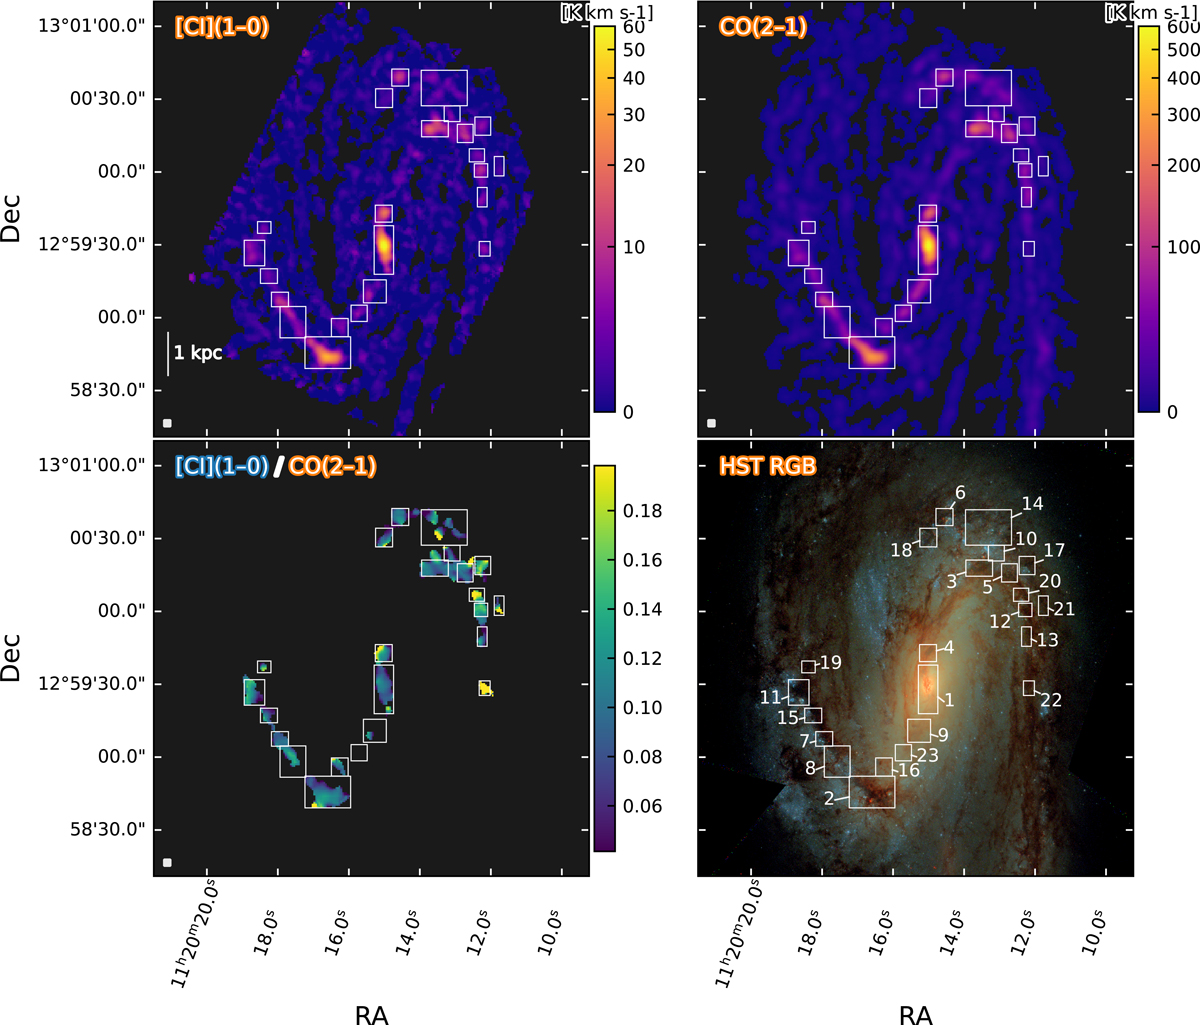
Download original image
Line intensity, ratio, and optical images of NGC 3627. Top panels: NGC 3627 [C I](1−0) (left) and CO(2−1) (right) integrated line intensity (moment-0) maps within our broad mask (representing high-completeness signals; see Appendix A). Bottom left panel: [C I](1−0)/CO(2−1) line ratio map within the combined signal mask. Bottom right panel: HST F814W − F555W − F438W RGB composite image (PHANGS-HST; Lee et al. 2022). Regions marked with the white boxes and labeled with numbers are mainly for illustration purpose and for discussion in the text. Their zoom-in images and extracted spectra are provided in our online data release. Examples for regions 1, 4, and 22 are presented in Appendix D. All images have the same field of view of 179″ × 179″ or 9.83 kpc × 9.83 kpc.
Current usage metrics show cumulative count of Article Views (full-text article views including HTML views, PDF and ePub downloads, according to the available data) and Abstracts Views on Vision4Press platform.
Data correspond to usage on the plateform after 2015. The current usage metrics is available 48-96 hours after online publication and is updated daily on week days.
Initial download of the metrics may take a while.