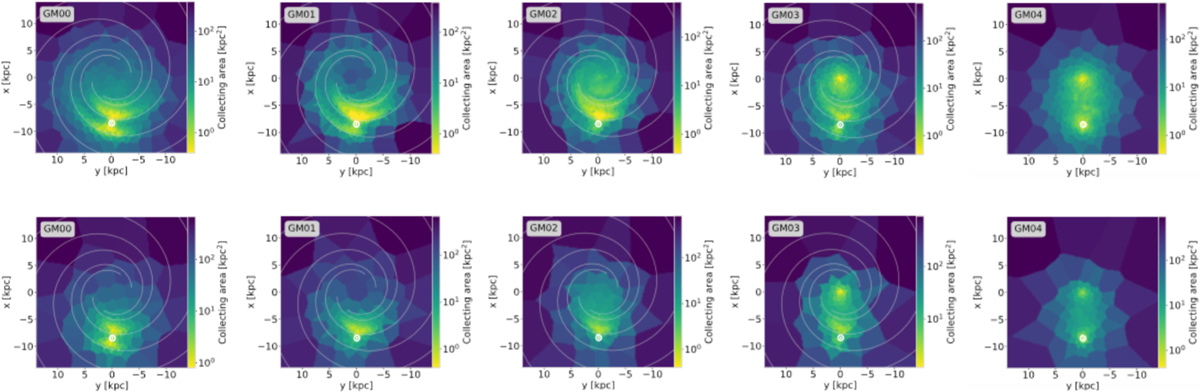
Fig. 8
Download original image
Radial distribution of modelled flux contributions for a theoretical observer (white circle) from 26Al (top) and 60Fe (bottom) decay. Each column represents average results of 500 model instantiations based on the density profiles GM00–GM04 (grey boxes). The models shown are stellar evolution models LC06, explodability S09, IMF K01, and SFR = 4 M⊙ yr−1. The latter corresponds to a total mass of 1.8 ± 0.2 M⊙ and 4.2 ± 0.2 M⊙ of 26Al and 60Fe, respectively. Adaptive spatial binning (Cappellari & Copin 2003) is used to obtain Voronoi tessellations as spatial bins, each of which contribute a flux of 10−6 ph cm−2 s−1 for the observer. The colour scale refers to the collecting area covered by each such pixel.
Current usage metrics show cumulative count of Article Views (full-text article views including HTML views, PDF and ePub downloads, according to the available data) and Abstracts Views on Vision4Press platform.
Data correspond to usage on the plateform after 2015. The current usage metrics is available 48-96 hours after online publication and is updated daily on week days.
Initial download of the metrics may take a while.