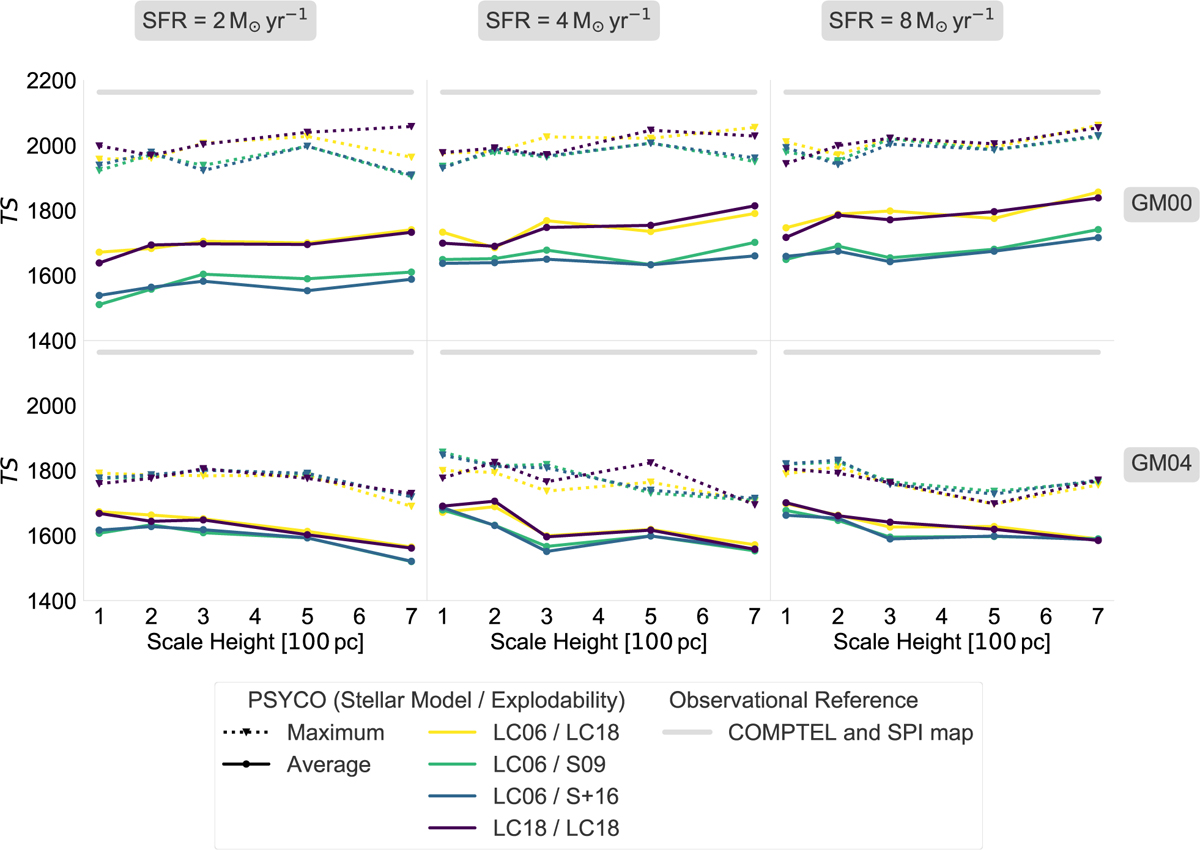
Fig. 10
Download original image
Likelihood ratio of 6000 sky maps modelled with PSYCO relative to the likelihood of a background-only fit with the SPI. Dots and solid lines denote the average values from 100 MC runs as a function of scale height. The colours correspond to stellar model configuration as noted in the legend. Triangles mark the maximum TS value obtained from the 100 MC samples for each model configuration. The thick grey lines denote the reference value obtained with COMPTEL (TS = 2160) and SPI (TS = 2166).
Current usage metrics show cumulative count of Article Views (full-text article views including HTML views, PDF and ePub downloads, according to the available data) and Abstracts Views on Vision4Press platform.
Data correspond to usage on the plateform after 2015. The current usage metrics is available 48-96 hours after online publication and is updated daily on week days.
Initial download of the metrics may take a while.