Fig. 13
Download original image
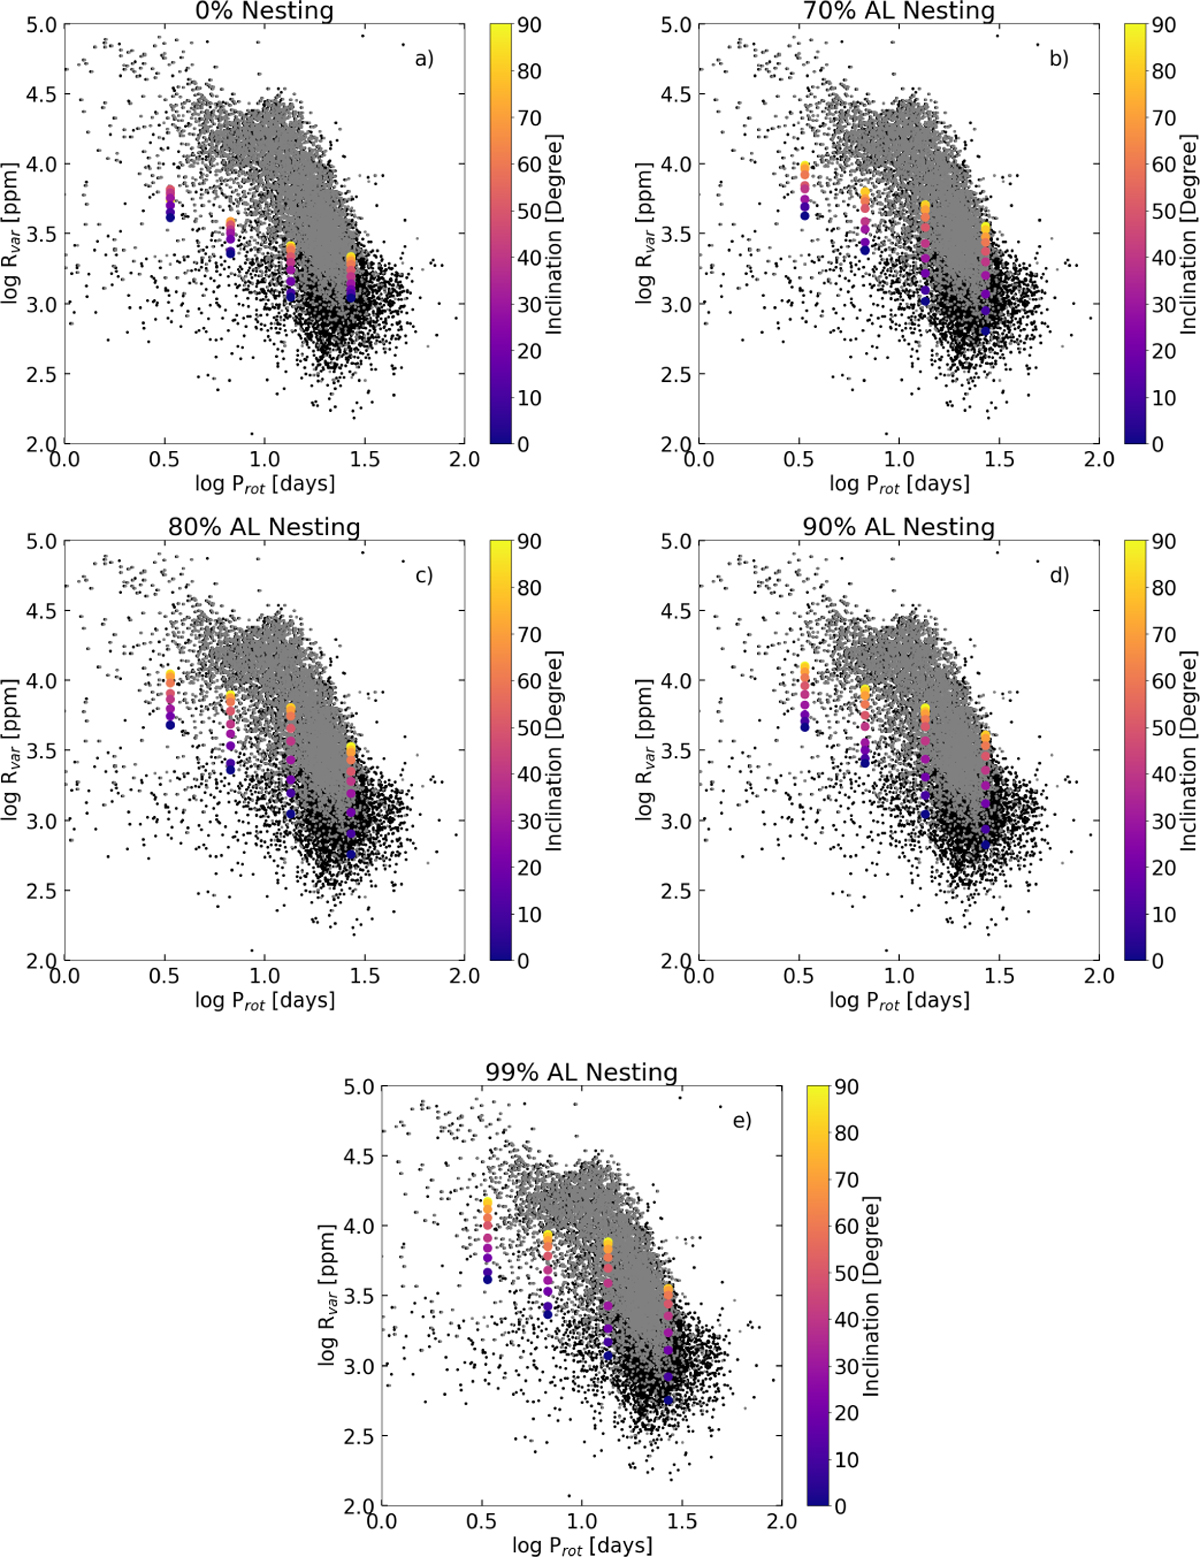
Comparison of Rvar as a function of the rotation period between stars with effective temperatures with 5500–6000 K and log g > 4.2 with detection rotation periods from McQ14 (grey dots) and S21 (black dots) and the modelled stars. Each panel includes different nesting probabilities p in the form of AL nesting. The different colours indicate the inclination of the modelled stars.
Current usage metrics show cumulative count of Article Views (full-text article views including HTML views, PDF and ePub downloads, according to the available data) and Abstracts Views on Vision4Press platform.
Data correspond to usage on the plateform after 2015. The current usage metrics is available 48-96 hours after online publication and is updated daily on week days.
Initial download of the metrics may take a while.