Fig. 3
Download original image
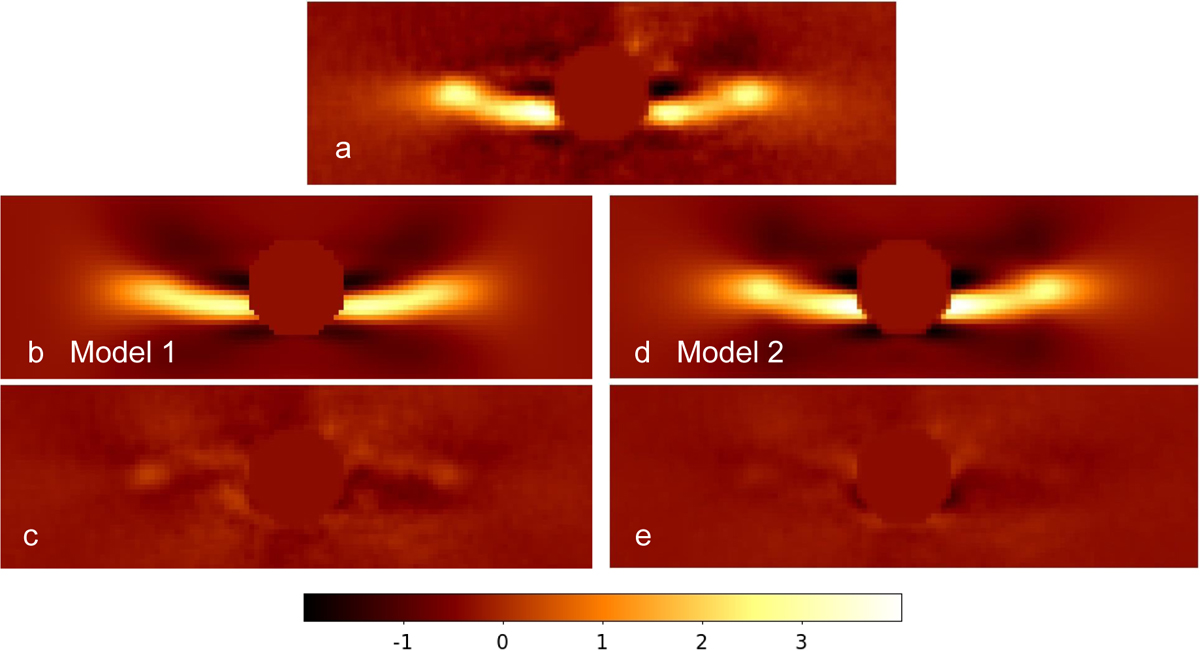
Comparison of the total intensity image (panel a) with the forward models of scattered light with a single HG function (panel b) and a two-component HG function (panel d). Panels c and e: residual images obtained after subtracting the forward model images from the total intensity image. The color bar shows the flux values in cts s−1.
Current usage metrics show cumulative count of Article Views (full-text article views including HTML views, PDF and ePub downloads, according to the available data) and Abstracts Views on Vision4Press platform.
Data correspond to usage on the plateform after 2015. The current usage metrics is available 48-96 hours after online publication and is updated daily on week days.
Initial download of the metrics may take a while.