Fig. 7
Download original image
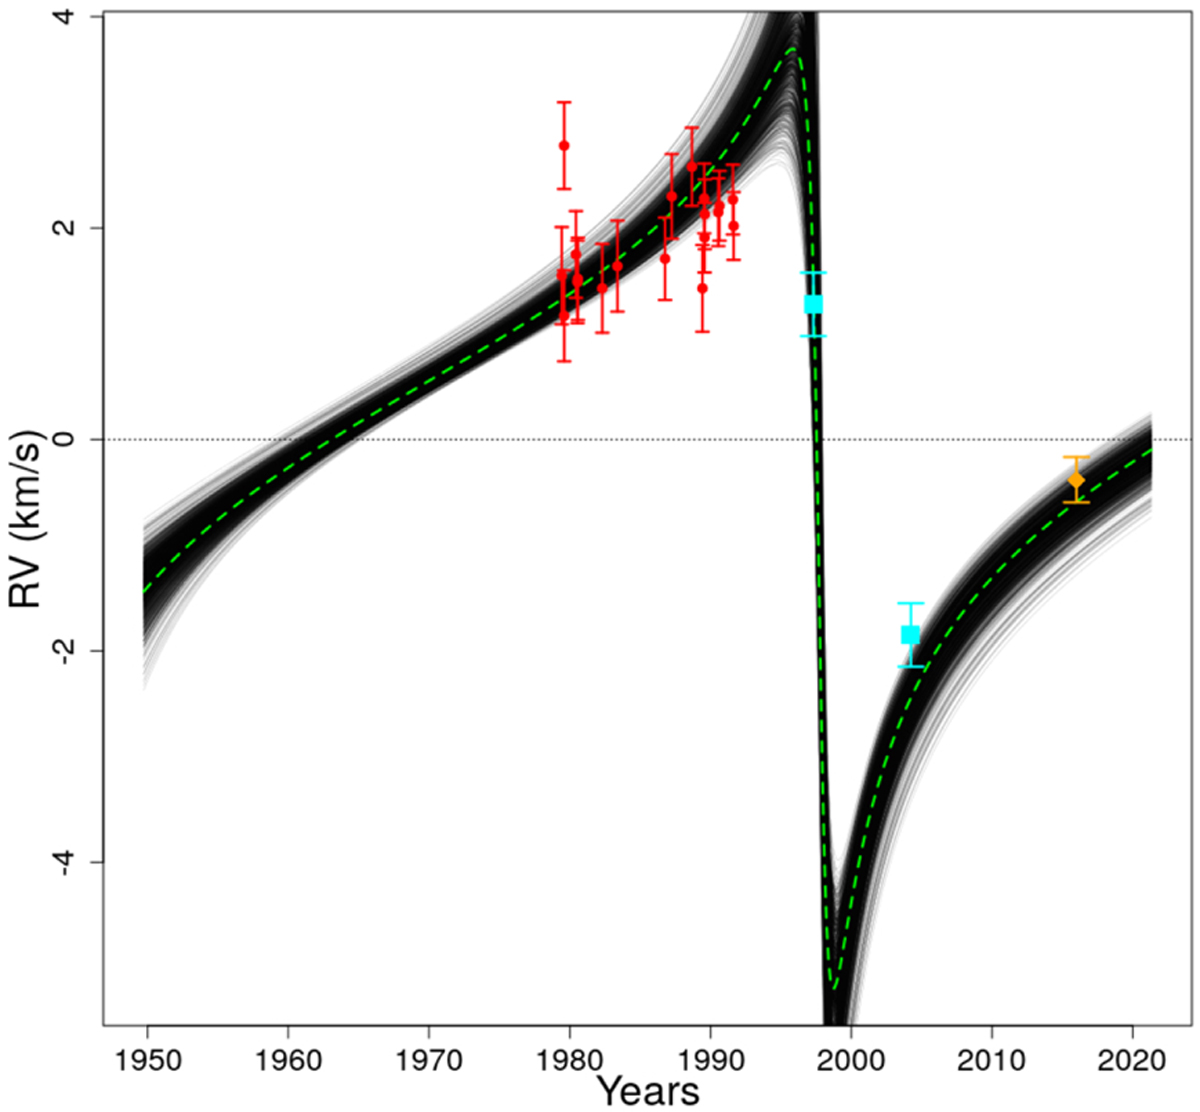
Radial velocity behaviour of HIP 88745 predicted by the adjustment of the HIPPARCOS and Gaia data. The green dotted line represents the TMB best-fit solution (values in Table 2, solution A) and the black lines show the MCMC solutions. The radial velocity observations from SB9 are in red, the Gaia DR3 radial velocity is in orange, and the ELODIE archive is shown in blue. The systemic velocity of RV0 = 0.40 km s−1 was determined from an adjustment of the SB9 radial velocities together with TD and Gaia observations, which was performed for the sole purpose of this visualisation.
Current usage metrics show cumulative count of Article Views (full-text article views including HTML views, PDF and ePub downloads, according to the available data) and Abstracts Views on Vision4Press platform.
Data correspond to usage on the plateform after 2015. The current usage metrics is available 48-96 hours after online publication and is updated daily on week days.
Initial download of the metrics may take a while.