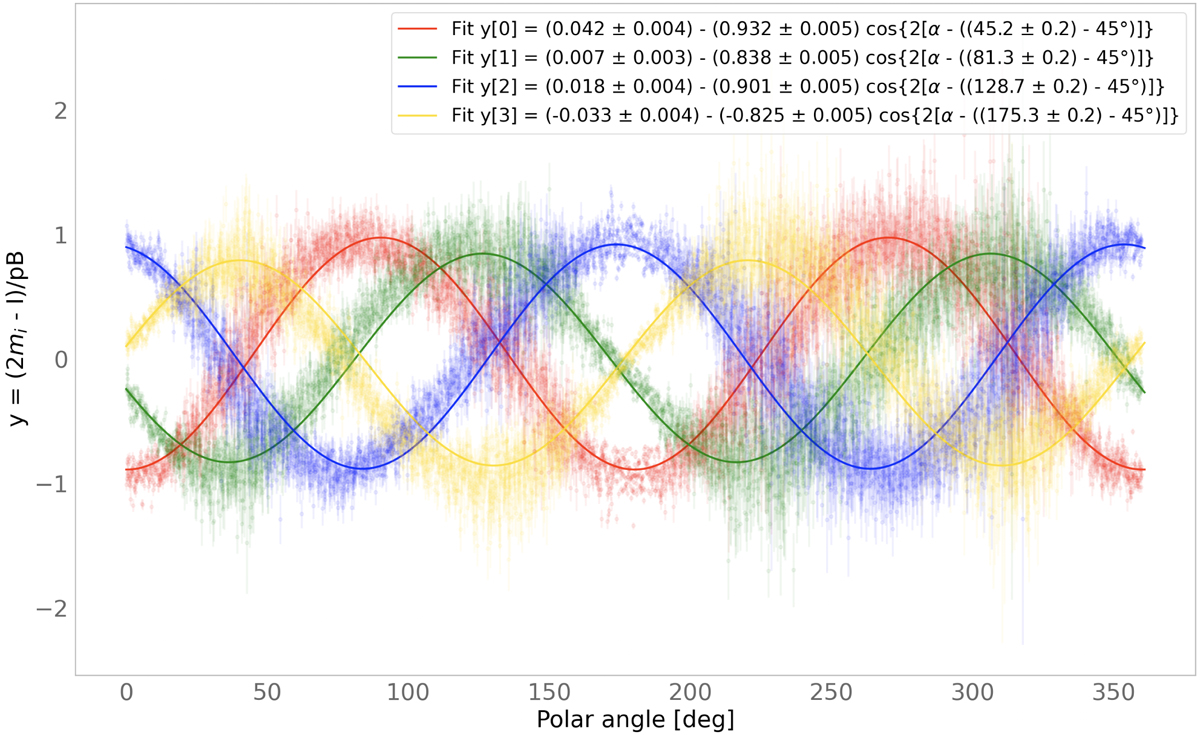
Fig. 6.
Download original image
Intensity modulation in each i-th image of the polarization set of four coronal images expressed in Eq. (4) as a function of the “polar angle”, α, shown in Fig. 5. The LCVR retardances, δi, were derived from the regression in Eq. (5). The data come from a quadruplet acquired during the “roll n.0” of the IT-7 campaign (June 8, 2020; Fig. 8) for a fixed heliocentric height (620 pixels from the Sun center in this particular case).
Current usage metrics show cumulative count of Article Views (full-text article views including HTML views, PDF and ePub downloads, according to the available data) and Abstracts Views on Vision4Press platform.
Data correspond to usage on the plateform after 2015. The current usage metrics is available 48-96 hours after online publication and is updated daily on week days.
Initial download of the metrics may take a while.