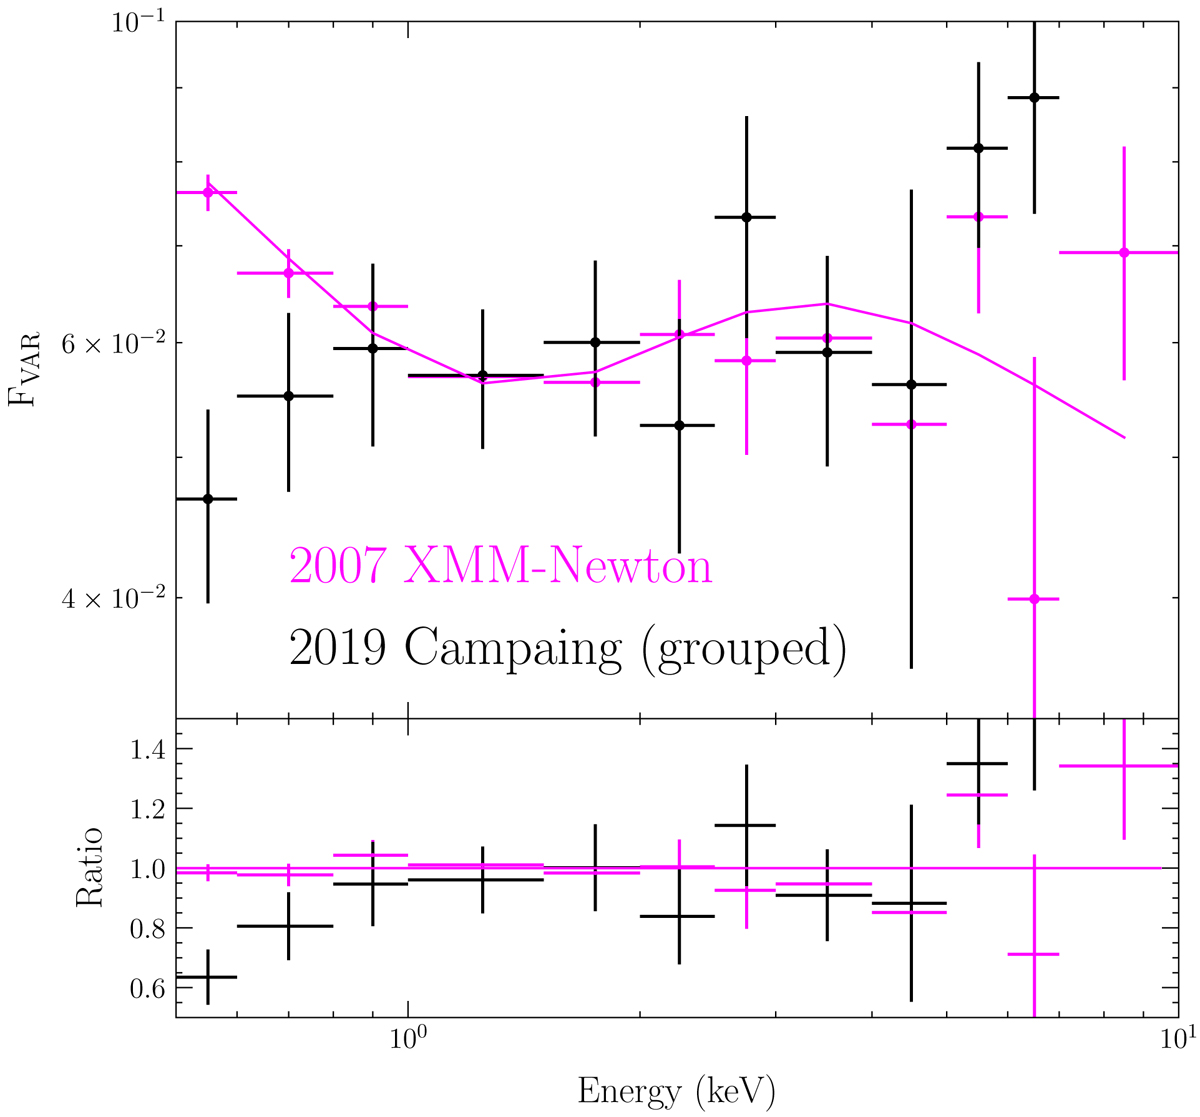
Fig. 4.
Download original image
Comparison between the Fvar spectrum of the 2007 and 2019 data. The 2019 observations (magenta) were obtained by grouping together the five exposures via the standard command SETPLOTGROUP within XSPEC. The spectrum derived from 2007 data is in black. The magenta curve represents a theoretical Fvar spectrum, which depicts the combined contribution from a variable power-law-like continuum and a variable soft excess.
Current usage metrics show cumulative count of Article Views (full-text article views including HTML views, PDF and ePub downloads, according to the available data) and Abstracts Views on Vision4Press platform.
Data correspond to usage on the plateform after 2015. The current usage metrics is available 48-96 hours after online publication and is updated daily on week days.
Initial download of the metrics may take a while.