Fig. 3
Download original image
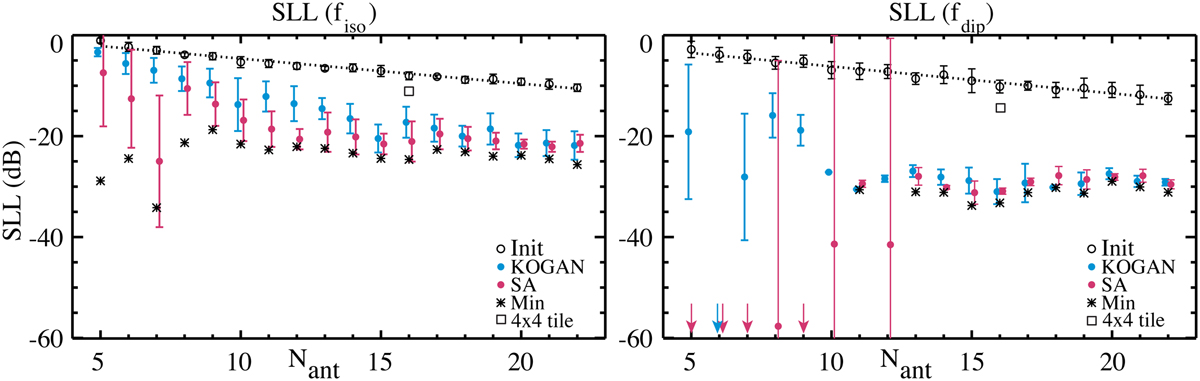
Values of SLL obtained with the two algorithms (SA and KOGAN) using the two element beam patterns fiso (left) and fdip (right). Each circular point is the mean and σ over Ninit = 10 runs. Values for the initial random distributions are plotted with the open circles. Values for the optimised distributions are shown by black filled circles for the KOGAN algorithm and light grey filled circles for the SA algorithm. The dotted line is the best fit of SLL values of the initial random distributions. The stars represent the best solutions obtained over the results of the two algorithms. The arrows indicate out-of-scale values (i.e. cancellation of side lobes). The hollow square represents the maximum SLL of −11.3 dB (with fiso) and of −14.4 dB (with fdip) in the case of a 4 × 4 tile with an element spacing of λ/2.
Current usage metrics show cumulative count of Article Views (full-text article views including HTML views, PDF and ePub downloads, according to the available data) and Abstracts Views on Vision4Press platform.
Data correspond to usage on the plateform after 2015. The current usage metrics is available 48-96 hours after online publication and is updated daily on week days.
Initial download of the metrics may take a while.