Fig. 2
Download original image
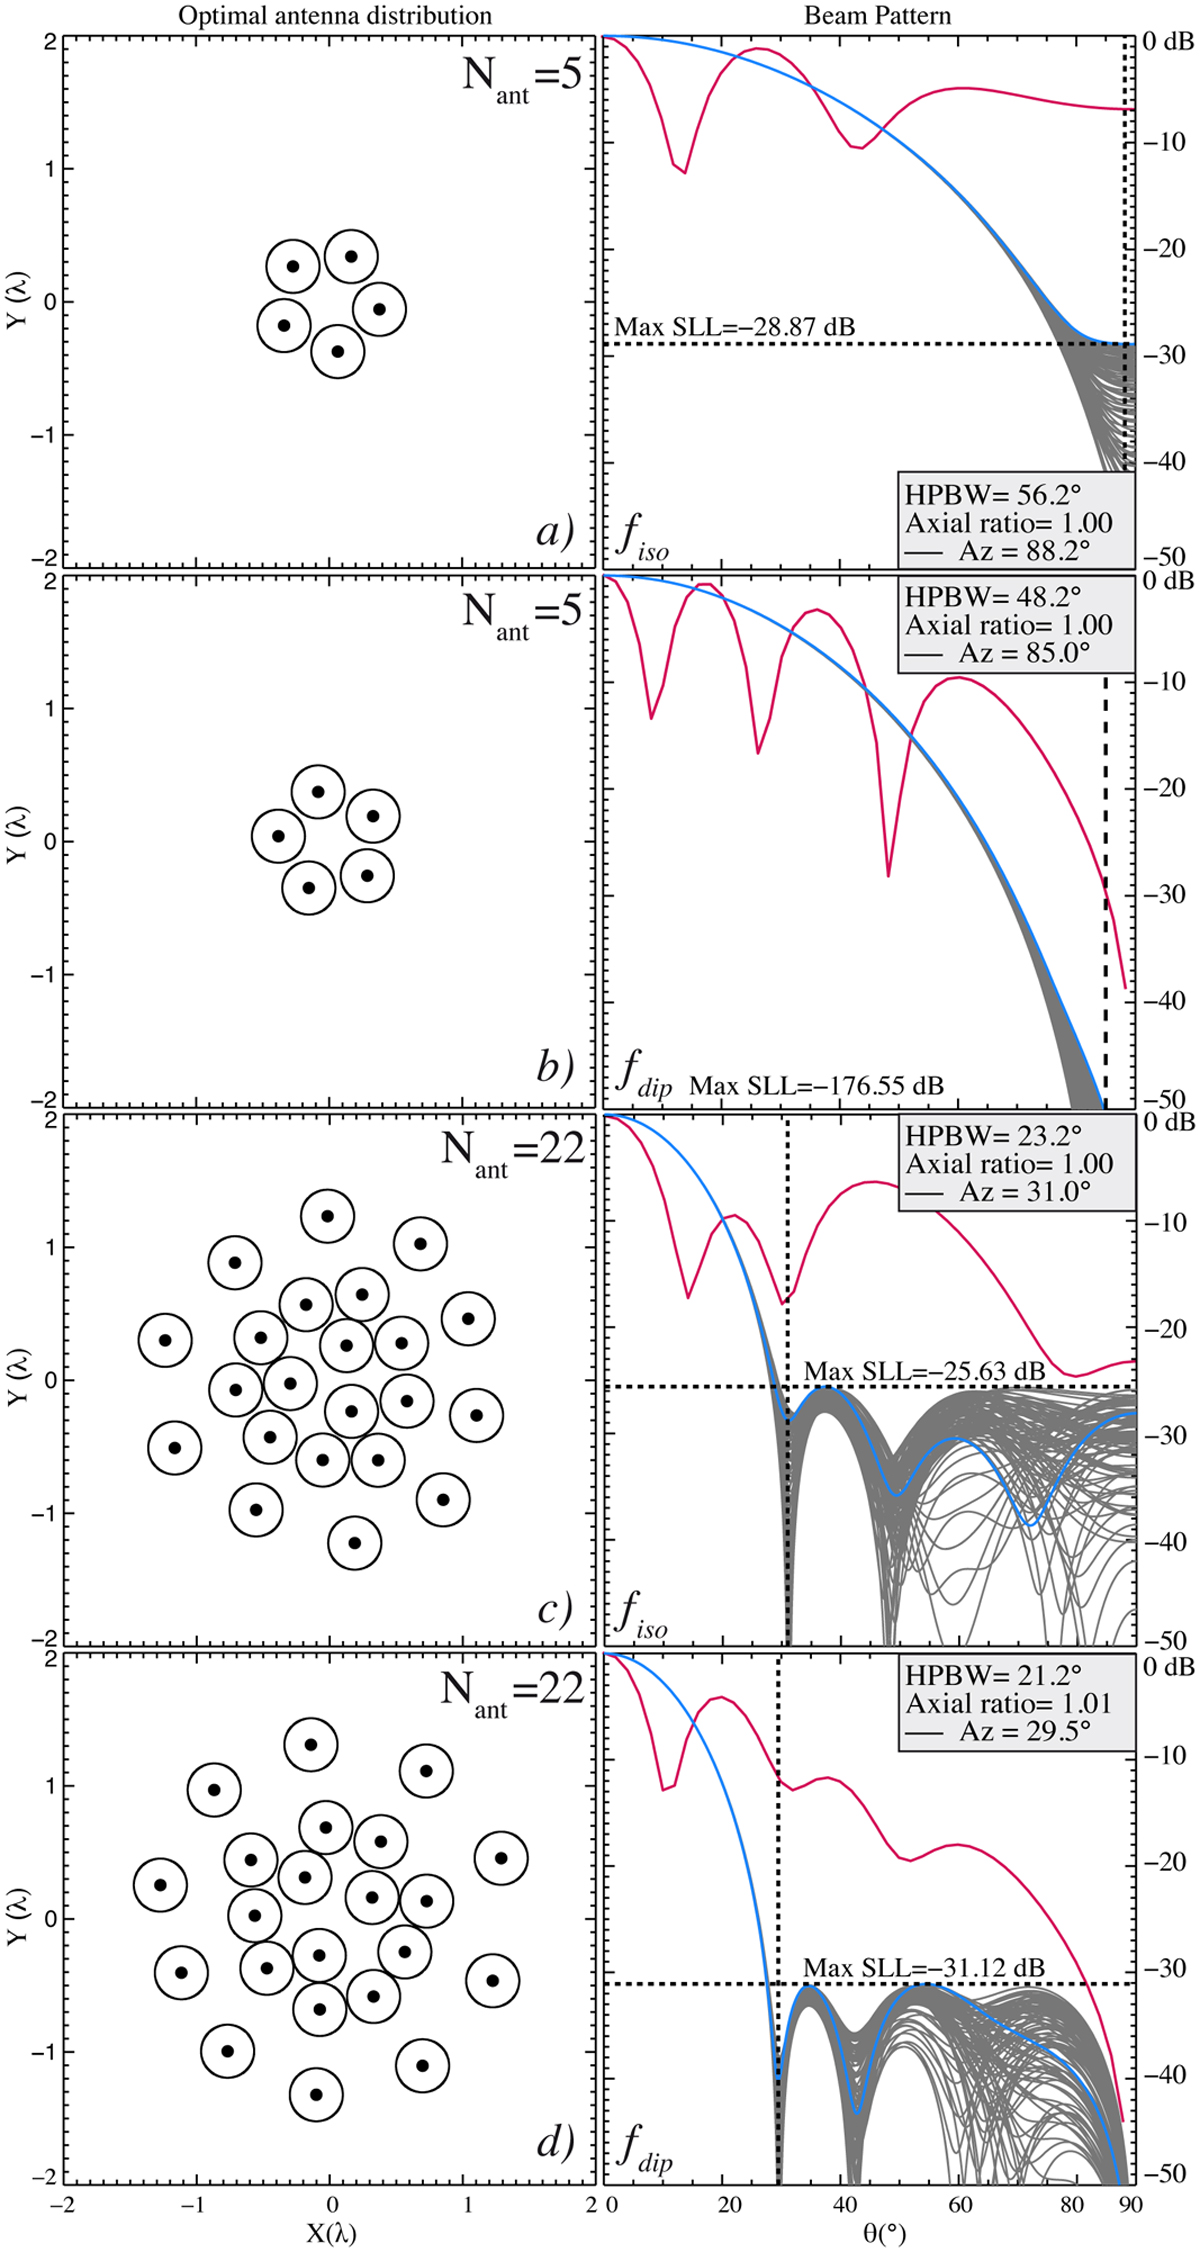
Optimal element distributions and their associated beam pattern profiles for Nant = 5 and Nant = 22 with the two element beam patterns fiso and fdip (from a to d). Left column: element positions in wavelength units. The black dots and the circles represent the element positions and the footprints of their effective area accounting for the minimal distance, respectively (Appendix A). Right column: Normalised power patterns. The red line is the beam profile where the maximum SLL has been located. The blue line is the profile where the maximum SLL is located on the optimal solution. The grey lines are the superimposed pattern azimuthal profiles sampled with 20° steps. The vertical dashed line locates the θ1s null, min (Eq. (4)) and the horizontal dashed line marks the SLL.
Current usage metrics show cumulative count of Article Views (full-text article views including HTML views, PDF and ePub downloads, according to the available data) and Abstracts Views on Vision4Press platform.
Data correspond to usage on the plateform after 2015. The current usage metrics is available 48-96 hours after online publication and is updated daily on week days.
Initial download of the metrics may take a while.