[https://doi.org/10.1051/0004-6361/202039465]
[https://doi.org/10.1051/0004-6361/201833583]
| Issue |
A&A
Volume 672, April 2023
|
|
|---|---|---|
| Article Number | C1 | |
| Number of page(s) | 4 | |
| Section | Interstellar and circumstellar matter | |
| DOI | https://doi.org/10.1051/0004-6361/202039465e | |
| Published online | 28 March 2023 | |
Physical and chemical structure of the Serpens filament: Fast formation and gravity-driven accretion (Corrigendum)
1
Max-Planck-Institut für Radioastronomie,
Auf dem Hügel 69,
53121
Bonn, Germany
e-mail: This email address is being protected from spambots. You need JavaScript enabled to view it.
; This email address is being protected from spambots. You need JavaScript enabled to view it.
2
Purple Mountain Observatory and Key Laboratory of Radio Astronomy, Chinese Academy of Sciences,
Nanjing
210034, PR China
3
Astronomy Department, Faculty of Science, King Abdulaziz University,
PO Box 80203,
Jeddah
21589, Saudi Arabia
4
South-Western Institute for Astronomy Research, Yunnan University,
Kunming,
650500
Yunnan, PR China
Key words: ISM: clouds / ISM: individual objects: the Serpens filament / radio lines: ISM / ISM: kinematics and dynamics / ISM: molecules / errata / addenda
1 Introduction
Due to a mistake in our plotting codes, we assigned incorrect names to the three embedded young stellar objects marked with green pluses in Fig. 1 of Gong et al. (2021). The correct names, which correspond to the sources reported in Table 3 of Enoch et al. (2009), are indicated in the revised version of Fig. 1 shown here. In the rest of the article, all instances of emb10, emb28, and emb16 should be replaced with emb16, emb10, and emb28, respectively. We provide below revised versions of Figs. 4, 14, and 16 with the correct names. The same issue also occurs in Gong et al. (2018).
Because of this issue, the results claimed for emb28 in Gong et al. (2018, 2021) correspond in fact to emb10. For instance, the detected molecular outflow is driven by the Class I protostar emb10 (see Fig. 4).
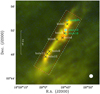 |
Fig. 1 Three-color composite image of the Serpens filament (Berschel 70 µm: blue, Berschel 250 µm: green, Berschel 500 µm: red). The three green pluses indicate the positions of the three embedded YSOs, emb10 (also knupown as IRAS 18262+0050), emb16, and emb28 (Enoch et al. 2009), while the crosses mark the positions of 1.1 mm dust cores (Enoch et al. 2007). The beam size (36″.3) for the 500 µm emission is shown in the lower right corner. The regions mapped with the IRAM-30 m and APEX telescopes are indicated by the red and white dashed boxes, respectively. |
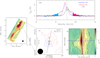 |
Fig. 4 Outflow driven by Ser-emb 10. Left: same as Fig. 2e in Gong et al. (2021). Right: (a) Observed 13CO (2−1) spectra of the two positions indicated by the blue and red pluses in panel b overlaid with the C18O spectrum of the position indicated by the yellow star in panel b. (b) 13CO (2−1) outflow map of Ser-emb 10. The blueshifted emission integrated from 2.0 to 5.5 kms−1 is shown in blue dashed contours which start at 0.20 K km s−1 (5σ) and increase by 0.20 K km s−1. The redshifted emission integrated from 9.4 to 12 km s−1 is shown in red dashed contours which start at 0.20 K km s−1 and increase by 0.20 K km s−1. The yellow star marks the position of Ser-emb 10. The beam size is shown in the lower left corner. (c) Position-velocity diagram of the 13CO (2−1) emission along the cut indicated by the black line in panel b. The contours start at 0.18 K (3σ) and increase by 0.36 K. The horizontal dashed line indicates the position of Ser-emb 10, and the vertical dashed line marks its systemic velocity of 7.87 km s−1. The resolution element is shown in the lower left corner. |
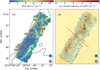 |
Fig. 14 (a) Local velocity gradient magnitude map overlaid with the H2 column density contours. (b) Herschel H2 column density map overlaid with the normalized velocity vector maps. The arrows represent the estimated local velocity gradients which are rotated by 180° in order to better visualize the accretion directions in SE. The polarized angle of the Planck 353 GHz thermal dust emission has been rotated by 90° to trace the magnetic field direction which is indicated by the red line. In both panels, the contours correspond to H2 column densities from 1×1021 cm−2 to 1.6×1022 cm−2 with a step of 3×1021 cm−2, and the beam sizes for the H2 column density and velocity gradient maps are shown as the gray and blue circles in the lower right corner. The three green pluses give the positions of the three embedded YSOs, emb10, emb16, and Ser-emb 28 (Enoch et al. 2009), and the white crosses mark the positions of the seven dust cores (Enoch et al. 2007). |
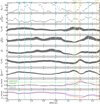 |
Fig. 16 Physical and chemical parameters (from top to bottom: position angle of local velocity gradient, magnitude of local velocity gradient, C18O rotational temperature, C18O column density, C18O fractional abundance, dust temperature, H2 column density, nonthermal velocity dispersion, and velocity centroid) along the crest of the Serpens filament indicated by the blue line in Fig. 2d of Gong et al. (2021). The origin of the offsets corresponds to the southern end of the blue line in Fig. 2d of Gong et al. (2021). The offset increases from south to north. The positions which are close to the seven 1.1 mm dust cores and the three YSOs are indicated by the cyan and orange vertical lines, respectively. In the two lowest panels, the data derived from C18O (1−0) and C18O (2−1) are indicated by blue and red symbols, respectively. |
References
- Enoch, M.L., Glenn, J., Evans, N.J., II, et al. 2007, ApJ, 666, 982 [NASA ADS] [CrossRef] [Google Scholar]
- Enoch, M.L., Evans, N.J., II, Sargent, A.I., & Glenn, J. 2009, ApJ, 692, 973 [NASA ADS] [CrossRef] [Google Scholar]
- Gong, Y., Li, G.X., Mao, R.Q., et al. 2018, A&A, 620, A62 [NASA ADS] [CrossRef] [EDP Sciences] [Google Scholar]
- Gong, Y., Belloche, A., Du, F.J., et al. 2021, A&A, 646, A170 [NASA ADS] [CrossRef] [EDP Sciences] [Google Scholar]
© The Authors 2023
 Open Access article, published by EDP Sciences, under the terms of the Creative Commons Attribution License (https://creativecommons.org/licenses/by/4.0), which permits unrestricted use, distribution, and reproduction in any medium, provided the original work is properly cited.
This article is published in open access under the Subscribe to Open model.
Open access funding provided by Max Planck Society.
All Figures
|
Fig. 1 Three-color composite image of the Serpens filament (Berschel 70 µm: blue, Berschel 250 µm: green, Berschel 500 µm: red). The three green pluses indicate the positions of the three embedded YSOs, emb10 (also knupown as IRAS 18262+0050), emb16, and emb28 (Enoch et al. 2009), while the crosses mark the positions of 1.1 mm dust cores (Enoch et al. 2007). The beam size (36″.3) for the 500 µm emission is shown in the lower right corner. The regions mapped with the IRAM-30 m and APEX telescopes are indicated by the red and white dashed boxes, respectively. |
| In the text | |
|
Fig. 4 Outflow driven by Ser-emb 10. Left: same as Fig. 2e in Gong et al. (2021). Right: (a) Observed 13CO (2−1) spectra of the two positions indicated by the blue and red pluses in panel b overlaid with the C18O spectrum of the position indicated by the yellow star in panel b. (b) 13CO (2−1) outflow map of Ser-emb 10. The blueshifted emission integrated from 2.0 to 5.5 kms−1 is shown in blue dashed contours which start at 0.20 K km s−1 (5σ) and increase by 0.20 K km s−1. The redshifted emission integrated from 9.4 to 12 km s−1 is shown in red dashed contours which start at 0.20 K km s−1 and increase by 0.20 K km s−1. The yellow star marks the position of Ser-emb 10. The beam size is shown in the lower left corner. (c) Position-velocity diagram of the 13CO (2−1) emission along the cut indicated by the black line in panel b. The contours start at 0.18 K (3σ) and increase by 0.36 K. The horizontal dashed line indicates the position of Ser-emb 10, and the vertical dashed line marks its systemic velocity of 7.87 km s−1. The resolution element is shown in the lower left corner. |
| In the text | |
|
Fig. 14 (a) Local velocity gradient magnitude map overlaid with the H2 column density contours. (b) Herschel H2 column density map overlaid with the normalized velocity vector maps. The arrows represent the estimated local velocity gradients which are rotated by 180° in order to better visualize the accretion directions in SE. The polarized angle of the Planck 353 GHz thermal dust emission has been rotated by 90° to trace the magnetic field direction which is indicated by the red line. In both panels, the contours correspond to H2 column densities from 1×1021 cm−2 to 1.6×1022 cm−2 with a step of 3×1021 cm−2, and the beam sizes for the H2 column density and velocity gradient maps are shown as the gray and blue circles in the lower right corner. The three green pluses give the positions of the three embedded YSOs, emb10, emb16, and Ser-emb 28 (Enoch et al. 2009), and the white crosses mark the positions of the seven dust cores (Enoch et al. 2007). |
| In the text | |
|
Fig. 16 Physical and chemical parameters (from top to bottom: position angle of local velocity gradient, magnitude of local velocity gradient, C18O rotational temperature, C18O column density, C18O fractional abundance, dust temperature, H2 column density, nonthermal velocity dispersion, and velocity centroid) along the crest of the Serpens filament indicated by the blue line in Fig. 2d of Gong et al. (2021). The origin of the offsets corresponds to the southern end of the blue line in Fig. 2d of Gong et al. (2021). The offset increases from south to north. The positions which are close to the seven 1.1 mm dust cores and the three YSOs are indicated by the cyan and orange vertical lines, respectively. In the two lowest panels, the data derived from C18O (1−0) and C18O (2−1) are indicated by blue and red symbols, respectively. |
| In the text | |
Current usage metrics show cumulative count of Article Views (full-text article views including HTML views, PDF and ePub downloads, according to the available data) and Abstracts Views on Vision4Press platform.
Data correspond to usage on the plateform after 2015. The current usage metrics is available 48-96 hours after online publication and is updated daily on week days.
Initial download of the metrics may take a while.