Fig. C.2.
Download original image
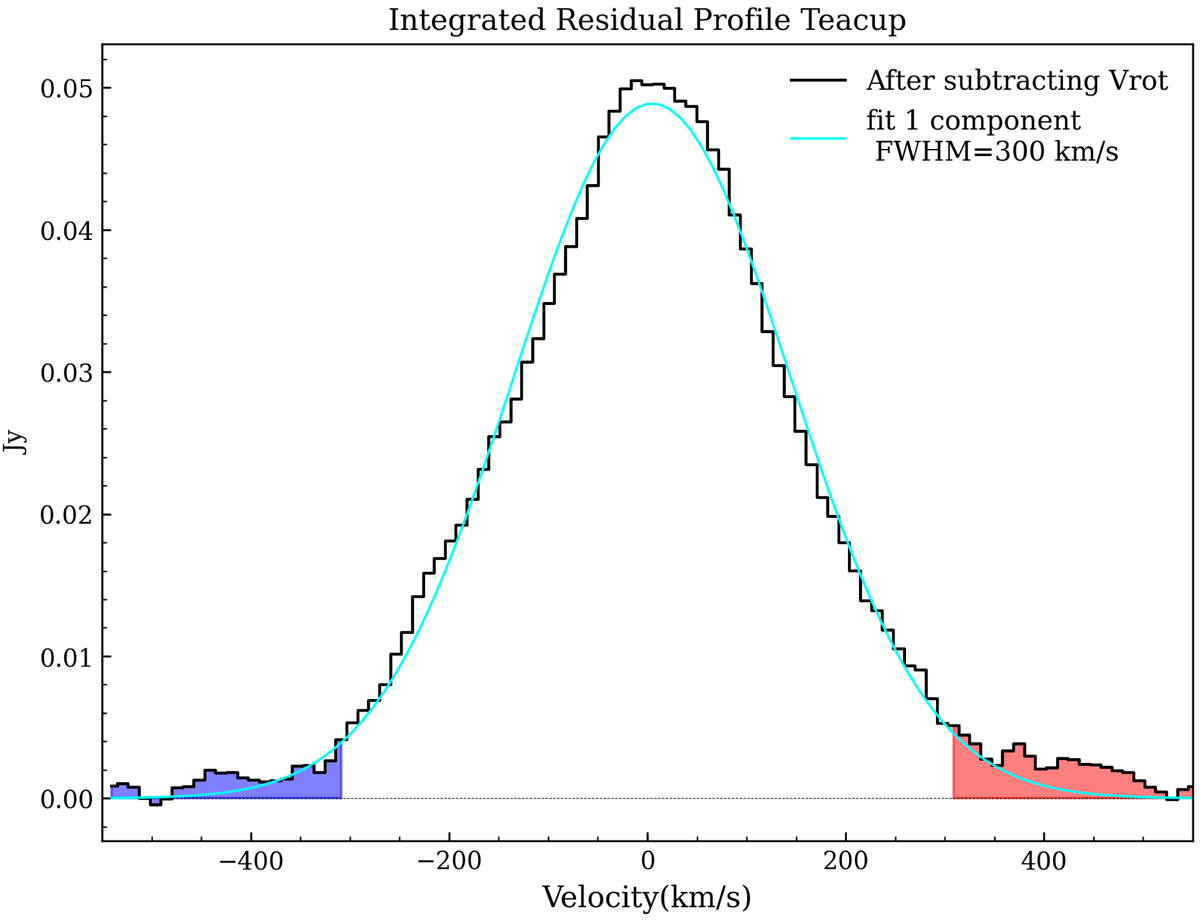
Integrated CO(2-1) residual profile after subtraction of the rotation curve. High-velocity blue and red wings are detected after subtraction. The cyan solid line corresponds to the fit with a single Gaussian component of FWHM∼330 km s−1 used in Scenario IV. The blue and red shaded areas correspond to the high-velocity gas considered to compute the outflow flux in Scenario III.
Current usage metrics show cumulative count of Article Views (full-text article views including HTML views, PDF and ePub downloads, according to the available data) and Abstracts Views on Vision4Press platform.
Data correspond to usage on the plateform after 2015. The current usage metrics is available 48-96 hours after online publication and is updated daily on week days.
Initial download of the metrics may take a while.