Fig. C.1.
Download original image
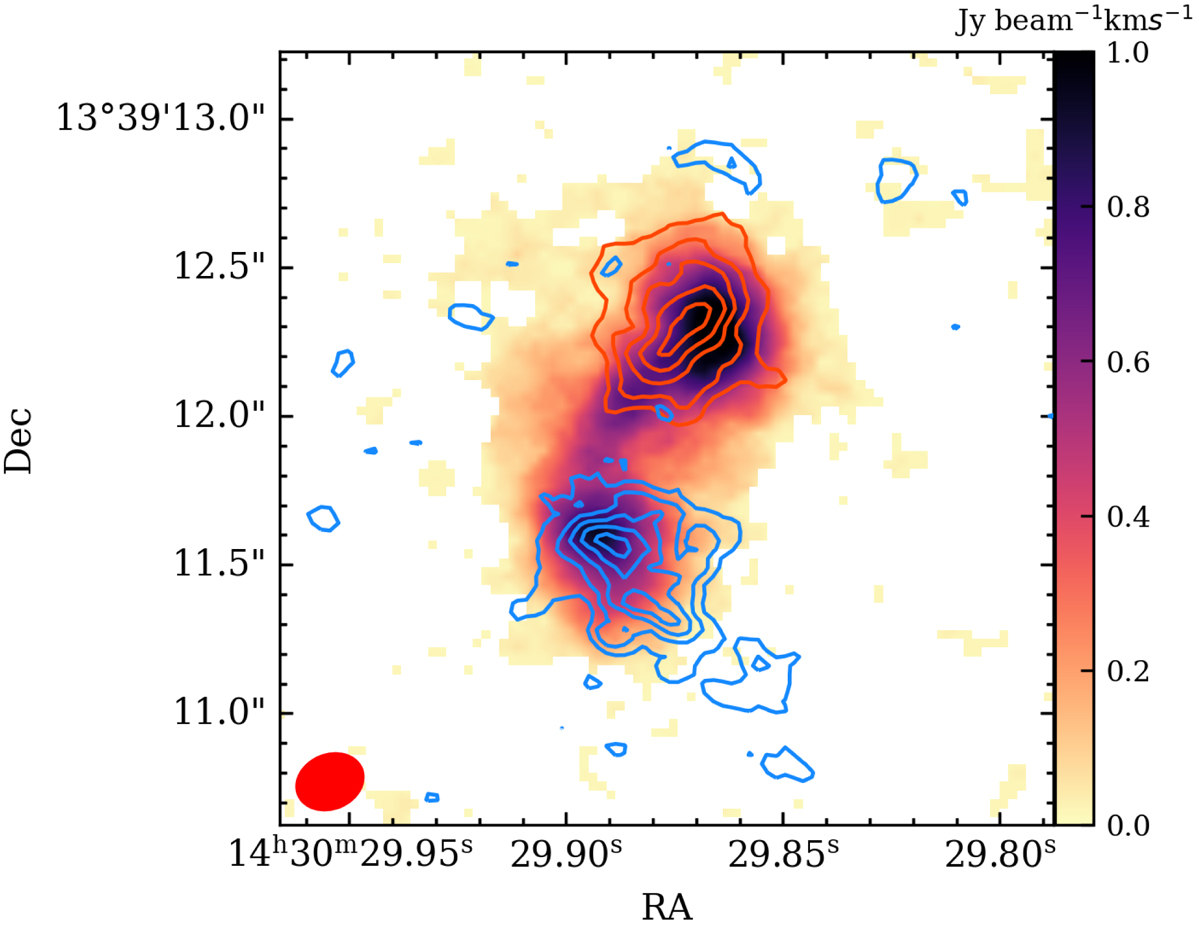
Integrated intensity of the high-velocity components of the CO(2-1) emission at 0![]() 2 resolution. The colour map corresponds to the moment 0 of the total CO(2-1) emission, and the contributions from velocities faster than v=±300 km s−1 are shown as red and blue contours at (0.35,0.5,0.65,0.8,0.95)×σmax, with
2 resolution. The colour map corresponds to the moment 0 of the total CO(2-1) emission, and the contributions from velocities faster than v=±300 km s−1 are shown as red and blue contours at (0.35,0.5,0.65,0.8,0.95)×σmax, with ![]() = 0.28 Jy beam−1 km s−1 and
= 0.28 Jy beam−1 km s−1 and ![]() = 0.14 Jy beam−1 km s−1. The beam size is indicated with a red ellipse in the bottom left corner.
= 0.14 Jy beam−1 km s−1. The beam size is indicated with a red ellipse in the bottom left corner.
Current usage metrics show cumulative count of Article Views (full-text article views including HTML views, PDF and ePub downloads, according to the available data) and Abstracts Views on Vision4Press platform.
Data correspond to usage on the plateform after 2015. The current usage metrics is available 48-96 hours after online publication and is updated daily on week days.
Initial download of the metrics may take a while.