Fig. B.1.
Download original image
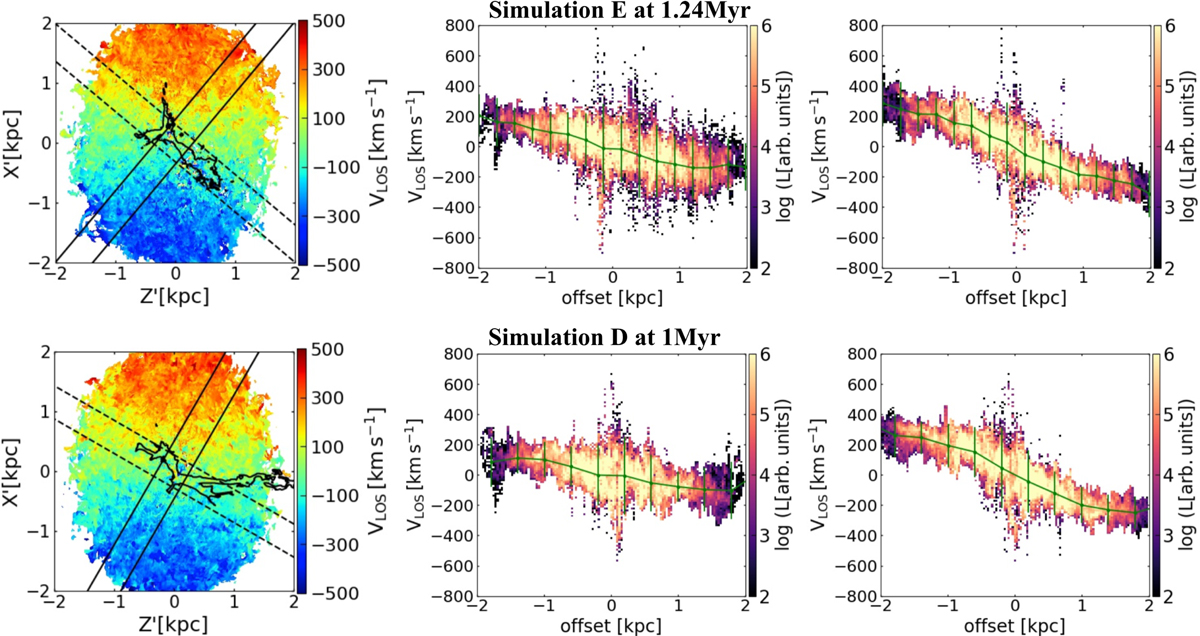
Snapshots of the mean velocity field and PVDs from Sim E (top panels, jet inclined 20° relative to the disc) and Sim D (bottom panels, jet inclined at 45°) for Pjet = 1045 erg s−1 at 1.24 Myr and 1 Myr, respectively. Left panels: Mean LOS velocity fields with the position of the slits of 500 pc width along (dashed lines) and perpendicular (solid lines) to the jet. Middle and right panels: PVDs along and perpendicular to the jet. The green curves are the mean velocity curve with ±2σ deviation, with a maximum deviations along and perpendicular to the jet reaching 408 (448) km s−1 and 434 (412) km s−1, respectively, for Sim E (Sim D).
Current usage metrics show cumulative count of Article Views (full-text article views including HTML views, PDF and ePub downloads, according to the available data) and Abstracts Views on Vision4Press platform.
Data correspond to usage on the plateform after 2015. The current usage metrics is available 48-96 hours after online publication and is updated daily on week days.
Initial download of the metrics may take a while.