Fig. 3.
Download original image
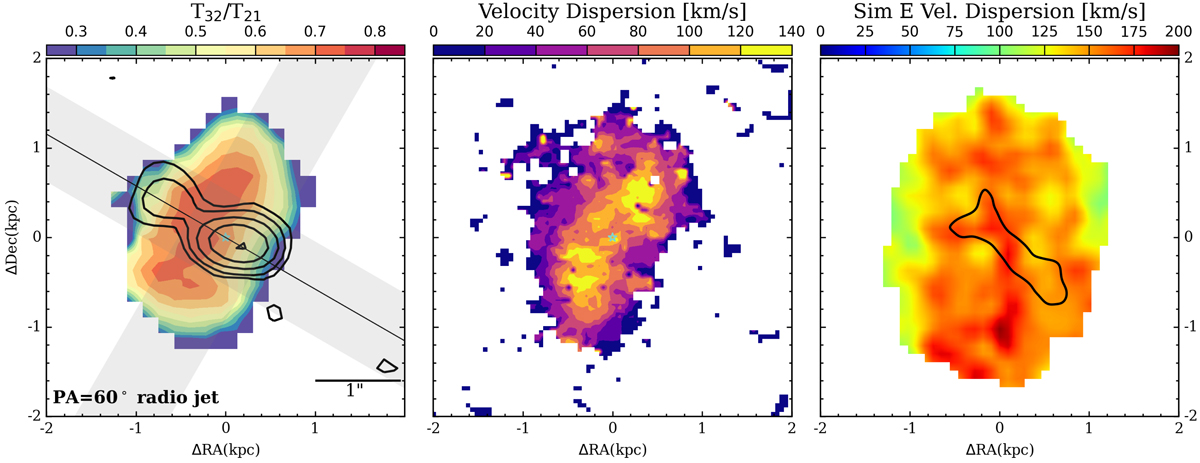
Brightness temperature ratio (T32/T21) and CO(2-1) velocity dispersion maps. The left panel shows the T32/T21 map at 0![]() 6 resolution with the VLA 6 GHz HR contours overlaid in black (at 4, 8, 16, 32, and 64σrms, with σrms = 23 μJy beam−1). The PAjet = 60° is indicated as a black solid line. The orientation and width (0
6 resolution with the VLA 6 GHz HR contours overlaid in black (at 4, 8, 16, 32, and 64σrms, with σrms = 23 μJy beam−1). The PAjet = 60° is indicated as a black solid line. The orientation and width (0![]() 6) of the slits used to produce the PVDs shown in Fig. 2 are indicated as grey shaded areas. The middle panel corresponds to the σ map of the CO(2-1) line emission at 0
6) of the slits used to produce the PVDs shown in Fig. 2 are indicated as grey shaded areas. The middle panel corresponds to the σ map of the CO(2-1) line emission at 0![]() 2 resolution. The cyan star in the left and middle panels indicates the peak of the 220 GHz ALMA continuum. On the right panel, we show the σ map of the gas from Simulation E in Meenakshi et al. (2022) for a jet power of Pjet = 1045 erg s−1, inclined 20° from the CO disc plane, and with an angle of ∼25° relative to the LOS.
2 resolution. The cyan star in the left and middle panels indicates the peak of the 220 GHz ALMA continuum. On the right panel, we show the σ map of the gas from Simulation E in Meenakshi et al. (2022) for a jet power of Pjet = 1045 erg s−1, inclined 20° from the CO disc plane, and with an angle of ∼25° relative to the LOS.
Current usage metrics show cumulative count of Article Views (full-text article views including HTML views, PDF and ePub downloads, according to the available data) and Abstracts Views on Vision4Press platform.
Data correspond to usage on the plateform after 2015. The current usage metrics is available 48-96 hours after online publication and is updated daily on week days.
Initial download of the metrics may take a while.