Fig. 1.
Download original image
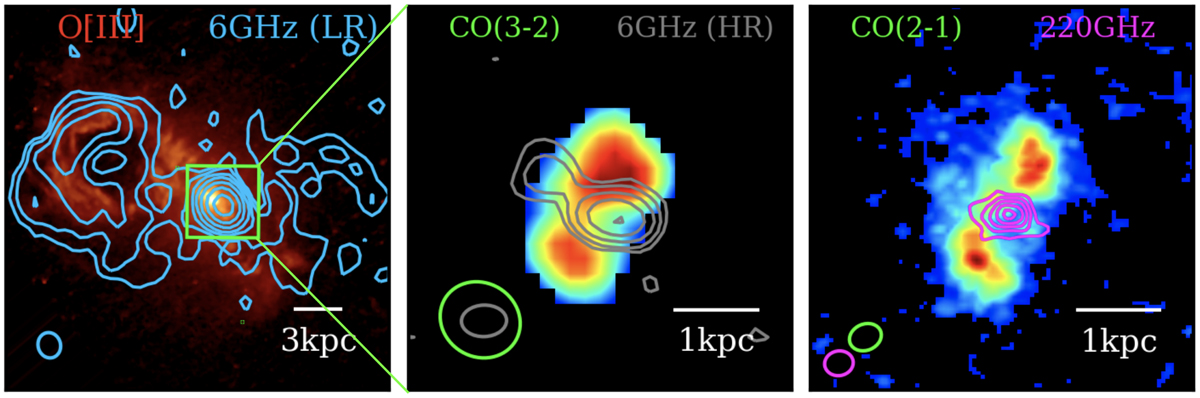
Teacup as seen in [O III], radio continuum, and CO. The left panel shows the large-scale (15″×15″) [O III]λ5007 Å HST image in colour with the low-resolution VLA 6 GHz continuum contours overlaid in blue. The middle panel shows the 2![]() 8×2
8×2![]() 8 peak intensity map of CO(3-2) with the high-resolution VLA 6 GHz continuum contours in grey. The right panel corresponds to the CO(2-1) peak intensity map with the ALMA 220 GHz continuum contours overlaid in magenta. The beam sizes are shown in the bottom-left corner of each panel with corresponding colours.
8 peak intensity map of CO(3-2) with the high-resolution VLA 6 GHz continuum contours in grey. The right panel corresponds to the CO(2-1) peak intensity map with the ALMA 220 GHz continuum contours overlaid in magenta. The beam sizes are shown in the bottom-left corner of each panel with corresponding colours.
Current usage metrics show cumulative count of Article Views (full-text article views including HTML views, PDF and ePub downloads, according to the available data) and Abstracts Views on Vision4Press platform.
Data correspond to usage on the plateform after 2015. The current usage metrics is available 48-96 hours after online publication and is updated daily on week days.
Initial download of the metrics may take a while.