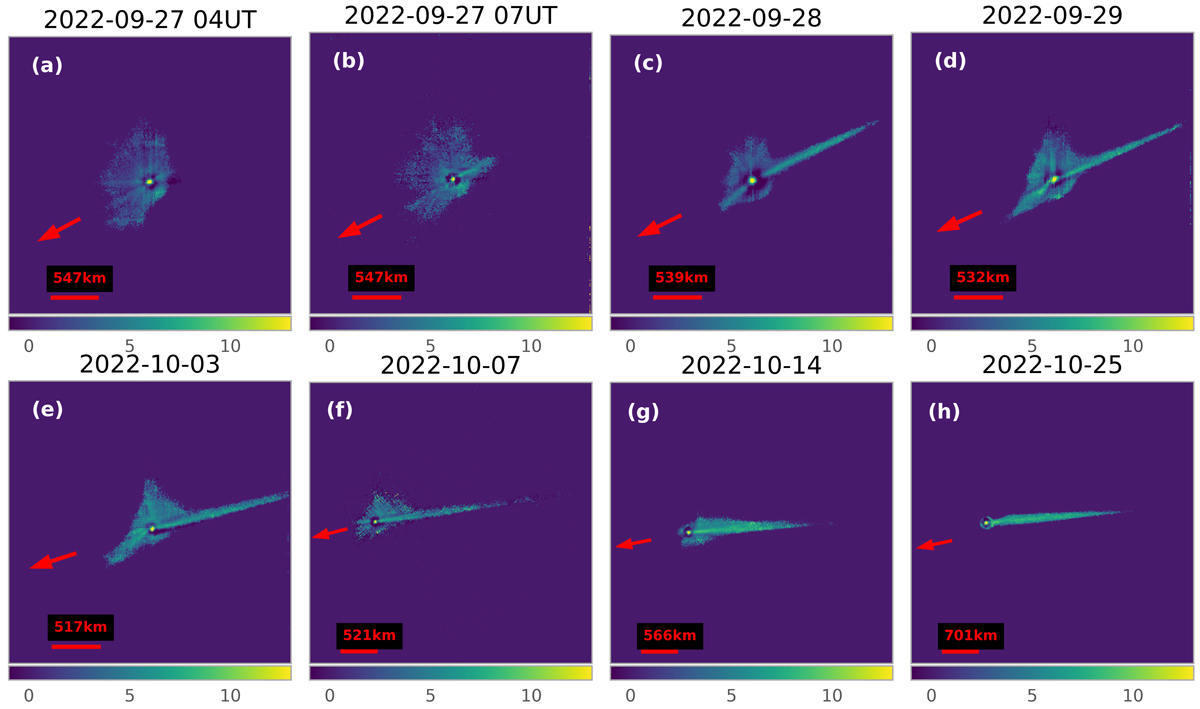
Fig. 3.
Download original image
Maps of the reflectance slope between 500 and 850 nm, normalised at 600 nm for WFM observations. The maps are oriented north up and east left. The direction of the Sun is indicated by a red arrow and a scale bar is shown in each panel. The time above each map is the average time of the stack; the reflectance slope indicated by the colour bar is expressed in units of %/100 nm. A cut-off was applied to mask spaxels with little to no target signal.
Current usage metrics show cumulative count of Article Views (full-text article views including HTML views, PDF and ePub downloads, according to the available data) and Abstracts Views on Vision4Press platform.
Data correspond to usage on the plateform after 2015. The current usage metrics is available 48-96 hours after online publication and is updated daily on week days.
Initial download of the metrics may take a while.