Open Access
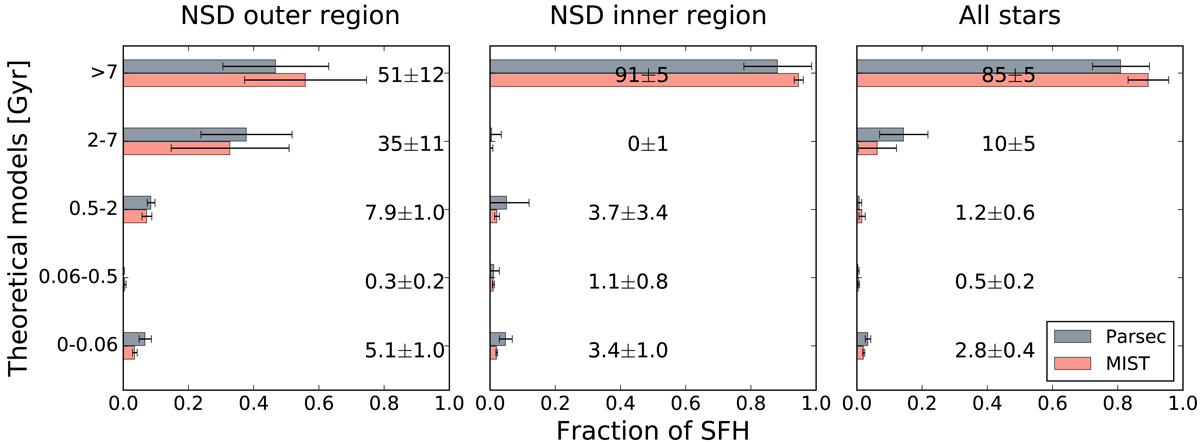
Fig. 6.
Download original image
Stellar populations present in the NSD outer region (left panel), inner region (central panel), and all the NSD stars in the sample (right panel). The numbers indicate the percentage of mass due to a given age bin and its standard deviation.
Current usage metrics show cumulative count of Article Views (full-text article views including HTML views, PDF and ePub downloads, according to the available data) and Abstracts Views on Vision4Press platform.
Data correspond to usage on the plateform after 2015. The current usage metrics is available 48-96 hours after online publication and is updated daily on week days.
Initial download of the metrics may take a while.