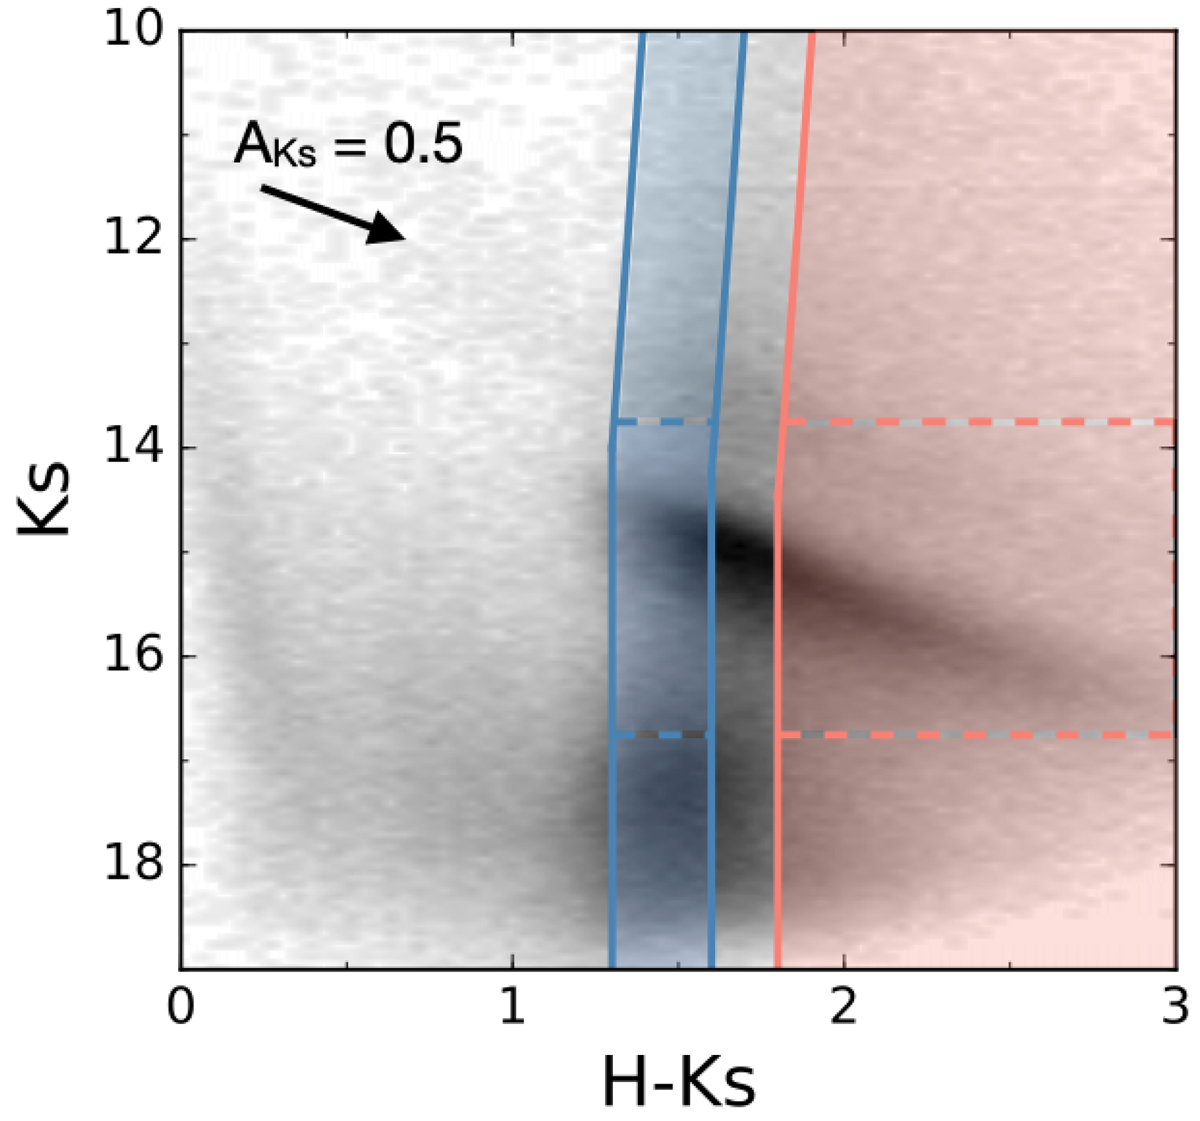
Fig. 2.
Download original image
CMD Ks versus H − Ks. The blue and salmon coloured regions indicate the two target groups of stars with different reddening dominated on average by stars from the closest edge of the NSD (NSD outer region) and stars deeper inside the NSD (NSD inner region), respectively. The dashed boxes show the reference stars used to build the extinction maps for each of the stellar groups analysed (see Sect. 4.1). The black arrow indicates the reddening vector.
Current usage metrics show cumulative count of Article Views (full-text article views including HTML views, PDF and ePub downloads, according to the available data) and Abstracts Views on Vision4Press platform.
Data correspond to usage on the plateform after 2015. The current usage metrics is available 48-96 hours after online publication and is updated daily on week days.
Initial download of the metrics may take a while.