| Issue |
A&A
Volume 671, March 2023
|
|
|---|---|---|
| Article Number | L1 | |
| Number of page(s) | 6 | |
| Section | Letters to the Editor | |
| DOI | https://doi.org/10.1051/0004-6361/202345904 | |
| Published online | 28 February 2023 | |
Letter to the Editor
First detection of radio recombination lines of ions heavier than helium
1
Shanghai Astronomical Observatory, Chinese Academy of Sciences, Shanghai 200030, PR China
e-mail: This email address is being protected from spambots. You need JavaScript enabled to view it.
; This email address is being protected from spambots. You need JavaScript enabled to view it.
; This email address is being protected from spambots. You need JavaScript enabled to view it.
2
Jet Propulsion Laboratory, California Institute of Technology, 4800 Oak Grove Drive, Pasadena, CA 91109, USA
3
Department of Astronomy, The University of Texas at Austin, 2515 Speedway, Stop C1400, Austin, Texas 78712-1205, USA
4
Department of Astronomy, Yunnan University, Kunming 650091, PR China
5
School of Astronomy and Space Sciences, University of Chinese Academy of Sciences, No. 19A Yuquan Road, Beijing 100049, PR China
6
National Astronomical Observatory of Japan, 2-21-1 Osawa, Mitaka, Tokyo 181-8588, Japan
7
Institute of Astronomy and Astrophysics, Academia Sinica, Roosevelt Road, Taipei 10617, Taiwan, R.O.C.
8
Center for Intelligent Computing Platforms, Zhejiang Laboratory, Hangzhou 311100, PR China
9
Nobeyama Radio Observatory, National Astronomical Observatory of Japan, National Institutes of Natural Sciences, 462-2 Nobeyama, Minamimaki, Minamisaku, Nagano 384-1305, Japan
10
Institute of Astronomy and Astrophysics, School of Mathematics and Physics, Anqing Normal University, Anqing, PR China
11
Kavli Institute for Astronomy and Astrophysics, Peking University, 5 Yiheyuan Road, Haidian District, Beijing 100871, PR China
12
Physical Research Laboratory, Navrangpura, Ahmedabad, Gujarat, 380009, India
Received:
13
January
2023
Accepted:
7
February
2023
Abstract
We report the first detection of radio recombination lines (RRLs) of ions heavier than helium. In a highly sensitive multi-band (12–50 GHz) line survey toward Orion KL with the TianMa 65-m Radio Telescope (TMRT), we successfully detected more than fifteen unblended α lines of RRLs of singly ionized species (XII) recombined from XIII. The Ka-band (26–35 GHz) spectrum also shows tentative signals of β lines of ions. The detected lines can be successfully crossmatched with the rest frequencies of RRLs of C II and/or O II. This finding greatly expands the scope of our understanding of ion RRLs, since prior to this work, only two blended lines (105α and 121α) of He II had been reported. Our detected lines can be fitted simultaneously under assumption of local thermodynamic equilibrium (LTE). An abundance of C III and O III of 8.8×10⁻⁴ was obtained, avoiding the complexities of optical and infrared observations and the blending of RRLs of atoms. It is consistent with but approaches the upper bound of the value (10−4–10−3) estimated from optical and infrared observations. The effects of dielectronic recombination may contribute to enhancing the level populations even at large n. We expect future observations using radio interferometers could break the degeneracy between C and O, while also helping to reveal the ionization structure and dynamical evolution of various ionized regions.
Key words: HII regions / radio lines: ISM / line: identification / stars: formation / ISM: abundances
© The Authors 2023
 Open Access article, published by EDP Sciences, under the terms of the Creative Commons Attribution License (https://creativecommons.org/licenses/by/4.0), which permits unrestricted use, distribution, and reproduction in any medium, provided the original work is properly cited.
This article is published in open access under the Subscribe to Open model. This email address is being protected from spambots. You need JavaScript enabled to view it. to support open access publication.
1. Introduction
Radio recombination lines (RRLs) are commonly defined as radio spectral lines resulting from transitions of high-n levels of atoms, appearing after the recombination of singly ionized ions and electrons (Gordon & Sorochenko 2002). Thus far, most of the detected RRLs are from transitions of neutral atoms (e.g., H, He, and C). Previously, He II 121α and 105α in NGC 7027 and NGC 6302 have only been reported (Chaisson & Malkan 1976; Terzian 1980; Mezger 1980; Walmsley et al. 1981; Gomez et al. 1987; Vallee et al. 1990). However, detections of RRLs of ions with mass larger than He have never been reported. Searches for RRLs of ions heavier than helium towards the Sun have also been unsuccessful (Berger & Simon 1972; Dravskikh & Dravskikh 2022).
There is a unique advantage in employing RRLs in studies of ionized gas compared with optical and infrared observations. Optical and infrared observations reveal complexities resulting from a non-LTE population, fluctuations in temperature and density, and non-negligible extinction (e.g., Peimbert 1967; Fich & Silkey 1991; Liu et al. 2001). These complexities can be easily avoided by RRLs. For example, the line ratio between RRLs of H and He could provide a direct measurement of He abundance, merely weakly dependent on temperature and density (Gordon & Sorochenko 2002; Anderson & Bania 2009; Anderson et al. 2011). Unfortunately, the study of heavier elements in ionized regions usually cannot take advantage of the benefits of RRLs. The RRLs of atoms heavier than helium, including C and O, which are the most important constituents of CO and interstellar complex organic molecules, have rest frequencies close to those of He RRLs, and the line blending makes them difficult to be spectrally resolved (e.g., Salas et al. 2019; Zhang et al. 2021). The RRLs of ions are expected not to be blended with RRLs of neutral atoms, thus measuring them would be extremely valuable for constraining the properties of elements heavier than helium in ionized states. Unlike He II, ions heavier than helium are usually multi-electron systems. Thus, RRLs of ions heavier than helium would also be very important for studying the mechanisms of recombination and level population (e.g., Storey 1981; Nussbaumer & Storey 1983; Nemer et al. 2019).
So, we consider whether it is possible to detect the RRLs of ions heavier than helium. From the multi-band spectrum of our on-going multi-band (12–50 GHz) TianMa 65-m Radio Telescope (TMRT) line survey of Orion KL, we successfully matched firm signals of RRLs of C II and O II. In this paper, we report the first detection of radio recombination lines (RRLs) of ions heavier than helium in Orion KL, and, to our knowledge, also in the interstellar medium.
2. Observations
Data in this work are mainly drawn from an ongoing TMRT line survey toward Orion KL (Fig. 1), which aims to cover the whole frequency range (1–50 GHz) of TMRT, beginning with the Q-band survey (34.8–50 GHz; Liu et al. 2022). Observations of the Ka-band (26–35 GHz) survey have been completed (Liu et al., in prep.), while the Ku-band survey (12–18 GHz) has been partially executed thus far.
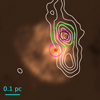 |
Fig. 1. Contours of SCUBA 850 μm dust emission (Orion KL; Di Francesco et al. 2008) overlaid on the 6 cm VLA continuum image of the M 42 H II region. The red cross is IRc2 of Orion KL (RA(J2000) = 05:35:14.55, Dec(J2000) = −05:22:31.0). The red pentagram denotes θ1 Ori C (RA(J2000) = 5:35:16.47, Dec(J2000) = −5:23:22.9), an O6-type star that is the dominant ionization source of M 42 (O’Dell & Yusef-Zadeh 2000). The pink, green, and black circles represent the beams of TMRT in Ka, Ku, and Q bands, respectively (Sect. 2). |
In the Ka-band line survey, mode 2 of the spectral backend (DIBAS) was adopted, which provides two independent frequency banks of 1.5 GHz, with the polarization of each bank having 16 384 channels, corresponding to a frequency resolution of 91.553 kHz (∼0.92 km s−1 at 30 GHz). The position-switching observation mode was adopted. The off-source position is 0.25° away (in azimuth direction) from the target. We shifted the frequency of the spectrometer banks to cover 26–35 GHz. The spectra were then chopped into segments of ∼100 MHz in frequency bandwidth. We manually fitted and subtracted the baselines to those segments before splicing them to obtain the final spectrum of Orion KL. For comparison, we also observed towards θ1 Ori C with one frequency setup in Ka band, covering the XII 98α transition (Table 1).
Gaussian parameters of ion RRLs of Orion KL.
The Ku-band observations also serve as part of the TMRT line survey. The frequency ranges covering the expected α lines of ions were preferentially observed. Mode 3 of the DIBAS was adopted, which provides two independent frequency banks of 500 MHz with a frequency resolution of 30.517 kHz (∼0.61 km s−1 at 15 GHz).
For the calibration, the signal from a noise diode is periodically injected. Under typical weather conditions at the TMRT in winter with an air pressure of 1000 mbar and a water vapor density of 8 g m−3, the zenith atmospheric opacities are 0.03 and 0.1 in the Ku and Ka band, respectively (Wang et al. 2017). Calibration uncertainties are estimated to be less than 20% (Wang et al. 2017; Liu et al. 2022).
3. Identification of ion RRLs
For a hydrogenic emitter with a total mass of M and a total charge of Z − 1 (where Z is the atomic charge of the species that has just recombined), the rest frequency of an RRL can be expressed as (Gordon & Sorochenko 2002):
 (1)
(1)
with the Rydberg constant R expressed as (Towle et al. 1996):
 (2)
(2)
Here, c is the speed of light, R∞ = 109737.31568 cm−1 (Tiesinga et al. 2021), me is the mass of electron, and M is the mass of the corresponding neutral atom. The Rydberg constants (in cm−1) for H, He, C, He II (He+), C II (C+), and O II (O+) are 109677.58, 109722.28, 109732.30, 109722.27, 109732.30, and 109733.55, respectively. The value of n is large for RRLs and it is thus valid to treat atoms and ions as hydrogenic emitters (Berger & Simon 1972), even through they may be not hydrogenic when n is small (Del Zanna & Storey 2022). The factor of Z2 could separate these lines from those of the neutral species, avoiding the blending issues described above.
3.1. Line matching
In the process of modeling the Ka-band spectrum of Orion KL, according to the procedure from Liu et al. (2022), we found six clean and broad (ΔV > 10 km s−1) line features that cannot be assigned to any RRLs of atoms (H, He, and C) or molecular lines (Fig. 2). Instead, we successfully matched them with the frequencies of RRLs of C II calculated in Eq. (1). Since the equivalent velocity offset between the same RRL transitions of oxygen and carbon is only ∼3.5 km s−1, which is much smaller than the typical line widths of RRLs, we cannot distinguish them at this stage and the emitter of detected ion RRLs is thus denoted as X. Furthermore, we successfully detected eight α lines of XII in follow-up Ku-band observations. The spectrum of Q-band survey has lower line sensitivity (higher noise) compared to the Ka-band one. Several α lines (n = 83, 84, 88, 89) are marginally detected in Q band. The XII98α are also firmly detected towards θ1 Ori C (left panel of Fig. 3). The results of the Gaussian fitting of the unblended α lines of XII are listed in Table 1.
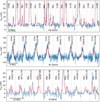 |
Fig. 2. Spliced spectrum (blue line) of Orion KL around the rest frequencies of RRLs of ions (C II or O II) in Ka band (upper panel), Ku band (middle panel), and Q band (lower panel). The Ka/Q spectra have been smoothed to have a spectral resolution (Δν) of 366.212 kHz. The Ku spectrum is unsmoothed with a Δν of 30.517 kHz. Segments separated by gray vertical lines cover different frequency ranges. The transition labels and the rest frequencies of the corresponding C II transitions (in unit of MHz) are shown on the top axis. The solid red line represents the model fitting of XII RRLs (Table 2). The dashed line includes the contributions of all the RRLs as well as all transitions of molecules identified in the Q-band survey (Liu et al. 2022) and Ka-band survey. |
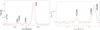 |
Fig. 3. Comparison between the spectra towards Orion KL (black) and towards θ1 Ori C (red) shown on the left. Comparison between the spectra towards Orion KL observed on different days shown on the right. |
For the β lines of XII, those with an even number of n have a rest frequency identical with that of XI(n/2)α, and will be highly blended with He(n/2)α. The β lines of XII with an odd number of n are unblended. The data do not contradict the model (Sect. 3.2), but the lines can only be tentatively detected under the sensitivity of this survey (Fig. 2).
The ion RRLs of different transitions are usually observed on different days, expanding a period of several months. The Doppler shifts introduced by earth revolution varied by tens of km s−1, much larger than the velocity shifts of detected lines. For example, we observed the XII120α towards Orion KL on two different days with a difference of Doppler shifts of 15 km s−1, and the velocities of the detected lines (in VLSR) remain unchanged (right panel of Fig. 3). The ion RRLs should originate from interstellar space.
3.2. Model fitting
The RRLs, including RRLs of ions, could be modeled following Eqs. (4)–(8) of of Liu et al. (2022). The peak value of optical depth can be derived as (Gordon & Sorochenko 2002):
 (3)
(3)
Here, EM is the emission measure (∫ninedl) in unit of cm−5, ni is the density of XZ+, ne is the density of free electrons, n1 (n2) is the quantum number of the lower (upper) level, bn2 is the upper-level departure coefficient, Δν is the line width in unit of Hz, and Te is the excitation temperature. The oscillator strength, fn1, n2, is independent of Z (Kardashev 1959; Goldwire 1968).
For RRLs from H II regions (RRLs of H, He and XII), the electron temperature (Te) is adopted as 8000 K (Wilson et al. 1997; Lerate et al. 2006). For RRLs of XII, the rest frequencies of C II RRLs are adopted (Eq. (1)). We assume that the high-n levels are in LTE (bn = 1). This assumption is valid for H RRLs of Orion KL (Zhu et al. 2022; Liu et al. 2022). Since the n values tend to be larger for XII RRLs, this assumption should also be valid for XII. For comparison, we also fit the carbon RRL from PDR assuming a Te of 300 K (Pabst et al. 2022). The Ku/Ka/Q-band line features can be well fitted simultaneously, suggesting that the RRLs of both atoms and ions are indeed in LTE. The fitted results are shown in Table 2 and Fig. 2.
Model parameters of RRLs.
The fitted velocity of XII RRL is −5.5 km s−1, assuming X to be carbon. If X is assumed to be oxygen, the fitted velocity will be −2 km s−1. These two values are both close to the velocity of −4 km s−1 derived from RRLs of H and He (Table 2), and the velocity differences are much smaller than the line widths (∼15 km s−1). Since the Ku-band lines tend to be systematically ∼2 km s−1 redder than those in Ka band, the uncertainty of fitted VLSR is estimated to be 2 km s−1. This may be caused by the larger beam at Ku band which thus covers more C III than O III (Sect. 3.3).
We also fitted the parameters of RRLs of θ1 Ori C (Table 2). The intensities of RRLs at Orion KL and θ1 Ori C are similar. The velocities of RRLs of H and He at θ1 Ori C are ∼4 km s−1 redder than at Orion KL. The XII RRLs at θ1 Ori C are ∼2 km s−1 redder and broader than at Orion KL.
3.3. Ion abundance and distribution
The extinction by absorption of dust and self-absorption can usually be neglected for RRLs. Thus, the abundance ratio of two ions can be simply derived from the intensity ratio of their RRLs. The fitted n(X2+)/n(H+), derived through EM(XII)/EM(H), is 8.8×10⁻⁴ at both Orion KL and θ1 Ori C. It is close to the solar abundances of C and O (8×10⁻⁴; Amarsi et al. 2021) and approaches the upper bound of the value of Orion Nebula estimated from optical/infrared observations (10−4–10−3; Simpson et al. 1986; Peimbert et al. 1993; Esteban et al. 1998). This may hint that the effects of dielectronic recombination could enhance the level populations of multi-electron ions at n values that can even be as high as ∼100 (Storey 1981; Nemer et al. 2019).
Helium can be excluded as the emitter of the detected RRLs, since it would give too large a value of VLSR of −33 km s−1. In addition, the high ionization energy of He II, 54.418 eV, would lead to a very small ratio of R(He III)/R(He II) of ∼0.02 for an O6 type star (Simón-Díaz & Stasińska 2008), and the He III region would be highly beam diluted in our observations (Fig. 1). The XIII abundance is much higher than the total abundance of nitrogen. Thus, the contribution of N II RRLs can also be ignored.
The ionization energy of C II, 24.383 eV, is close to the value of He I, 24.587 eV. Thus, the distribution of C III is expected to be as extended as He II, as revealed by optical observations (Walter 1991; Esteban et al. 1998). However, the contribution of oxygen can not be excluded. The fitted velocities of Ka-band lines at Orion KL and Ku-band lines at θ1 Ori C are closer to the values of H/He RRLs if they are assigned to oxygen ions. It is also consistent with the value derived from the O III optical lines (VLSR ∼ 0 ± 3 km s−1; Abel et al. 2019). In contrast, the fitted velocities of Ku-band lines at Orion KL are closer to the values of H/He RRLs if carbon is adopted. This is consistent with the scenario that the inner part of the XIII region of M 42 is dominated by O III, while C III dominates the outer part, since the ionization energy of On+ is larger than of Cn+.
4. Discussion
As mentioned in Sect. 1, only two lines of He II have been reported previously. The rest frequency of He II 121α (14672.069 MHz) is coincident with that of He160κ (14672.078 MHz), and close to that of H195τ (14672.993 MHz). The He II105α (22411.329 MHz) is blended with He129θ (22411.276 MHz). In ionized regions with very hard ionizing spectrum, those He II lines could overwhelm the blending high-order He lines. However, the intensity of those He II lines may be weaker than the He lines for ionized regions such as the Orion Nebula (Fig. 2). Further observations and modeling are probably needed to examine the blending issue of the He II RRLs lines. This study detected tens of lines of RRLs of carbon and oxygen, many of them are unblended, which will be very helpful for further studies of ion RRLs in both observation and theory.
Future high spectral and spatial resolution mapping observations of RRLs of ions in different ionization states with the state-of-the-art interferometers such as ALMA (band 1), SKA or ngVLA can reveal the ionization structure and break the degeneracy between C and O. This would measure the distributions and abundances of these ions, and consequently elements heavier than helium directly and separately. Such a technique would be very valuable to study the abundances of carbon and oxygen in the inner Galaxy, where optical observations are very difficult. Studies with optical lines are limited to Rgal > 5 kpc for oxygen and Rgal > 6 kpc for carbon (Méndez-Delgado et al. 2022). The abundance of C and O affects the conversion of CO luminosity into molecular gas mass (Gong et al. 2020; Hu et al. 2022). Higher abundances in the inner Galaxy, along with higher temperatures, will lower the molecular gas masses and, consequently, the predicted star formation rates in the inner Galaxy, alleviating the long-standing discrepancy between predicted and observed star formation rates in the inner Galaxy (Evans et al. 2022). In addition, RRLs of ions tend to have smaller thermal line widths and the RRLs of ions may serve as a good tracer of gas motions inside H II regions. This will be helpful in constraining the structures and dynamical evolution models for highly embedded H II regions. Observations of these RRLs of ions in deeply embedded ultra-compact H II regions, where the electron density is much higher than in the Orion Nebula, could help to constrain the theory of collisional broadening of Rydberg transitions in ions (e.g., Olofsson et al. 2021).
5. Summary
We successfully detected and identified the RRLs of ions heavier than helium in the insterstellar meidum for the first time, during the conduction of the on-going TMRT multi-band (12–50 GHz) line survey towards Orion KL. More than fifteen unblended α lines of RRLs of C II and/or O II are detected. The sensitive Ka-band spectrum even shows tentative signals of β lines. All the detected lines can be aptly fitted simultaneously under the assumption of LTE, yielding an abundance of C III and/or O III of 8.8×10⁻⁴. The RRL of ions are extremely useful, serving as a direct and model-independent measurement of the abundances of elements heavier than helium.
The ion RRLs at Orion KL and θ1 Ori C have similar intensities but slightly shifted velocities of ∼2 km s−1. We prefer to adopt the interpretation that the detected lines towards Orion KL are blended RRLs of C II and O II, while those directed towards θ1 Ori C may be dominated by O II RRLs. We expect that future ion RRL observations using interferometers with improved resolution and sensitivities can reveal the ionization structures of ionized regions in broader scale environments in detail.
Acknowledgments
We wish to thank the staff of the TMRT 65 m for their help during the observations. This work has been supported by the National Key R&D Program of China (No. 2022YFA1603100). X.L. acknowledges the supports by NSFC No. 12203086 and No. 12033005 and CPSF No. 2022M723278. T.L. acknowledges the supports by National Natural Science Foundation of China (NSFC) through grants No. 12073061 and No.12122307, the international partnership program of Chinese Academy of Sciences through grant No. 114231KYSB20200009, Shanghai Pujiang Program 20PJ1415500 and the science research grants from the China Manned Space Project with no. CMS-CSST-2021-B06. This research was carried out in part at the Jet Propulsion Laboratory, which is operated by the California Institute of Technology under a contract with the National Aeronautics and Space Administration (80NM0018D0004). K.T. was supported by JSPS KAKENHI (Grant Number 20H05645). We show warm thanks to the anonymous referee for providing many deep-insight comments for improving the paper.
References
- Abel, N. P., Ferland, G. J., & O’Dell, C. R. 2019, ApJ, 881, 130 [Google Scholar]
- Amarsi, A. M., Grevesse, N., Asplund, M., & Collet, R. 2021, A&A, 656, A113 [NASA ADS] [CrossRef] [EDP Sciences] [Google Scholar]
- Anderson, L. D., & Bania, T. M. 2009, ApJ, 690, 706 [NASA ADS] [CrossRef] [Google Scholar]
- Anderson, L. D., Bania, T. M., Balser, D. S., & Rood, R. T. 2011, ApJS, 194, 32 [NASA ADS] [CrossRef] [Google Scholar]
- Berger, P. S., & Simon, M. 1972, ApJ, 171, 191 [NASA ADS] [CrossRef] [Google Scholar]
- Chaisson, E. J., & Malkan, M. A. 1976, ApJ, 210, 108 [NASA ADS] [CrossRef] [Google Scholar]
- Del Zanna, G., & Storey, P. J. 2022, MNRAS, 513, 1198 [NASA ADS] [CrossRef] [Google Scholar]
- Di Francesco, J., Johnstone, D., Kirk, H., MacKenzie, T., & Ledwosinska, E. 2008, ApJS, 175, 277 [Google Scholar]
- Dravskikh, A. F., & Dravskikh, Y. A. 2022, Astron. Rep., 66, 490 [NASA ADS] [CrossRef] [Google Scholar]
- Esteban, C., Peimbert, M., Torres-Peimbert, S., & Escalante, V. 1998, MNRAS, 295, 401 [NASA ADS] [CrossRef] [Google Scholar]
- Evans, N. J., Kim, J.-G., & Ostriker, E. C. 2022, ApJ, 929, L18 [NASA ADS] [CrossRef] [Google Scholar]
- Fich, M., & Silkey, M. 1991, ApJ, 366, 107 [NASA ADS] [CrossRef] [Google Scholar]
- Goldwire, H. C., Jr 1968, ApJS, 17, 445 [NASA ADS] [CrossRef] [Google Scholar]
- Gomez, Y., Rodriguez, L. F., & Garcia-Barreto, J. A. 1987, Rev. Mex. Astron. Astrophys., 14, 560 [Google Scholar]
- Gong, M., Ostriker, E. C., Kim, C.-G., & Kim, J.-G. 2020, ApJ, 903, 142 [CrossRef] [Google Scholar]
- Gordon, M. A., & Sorochenko, R. L. 2002, Radio Recombination Lines. Their Physics and Astronomical Applications (Berlin: Springer), 282 [CrossRef] [Google Scholar]
- Hu, C.-Y., Schruba, A., Sternberg, A., & van Dishoeck, E. F. 2022, ApJ, 931, 28 [NASA ADS] [CrossRef] [Google Scholar]
- Kardashev, N. S. 1959, Soviet. Astron., 3, 813 [NASA ADS] [Google Scholar]
- Lerate, M. R., Barlow, M. J., Swinyard, B. M., et al. 2006, MNRAS, 370, 597 [CrossRef] [Google Scholar]
- Liu, X. W., Barlow, M. J., Cohen, M., et al. 2001, MNRAS, 323, 343 [NASA ADS] [CrossRef] [Google Scholar]
- Liu, X., Liu, T., Shen, Z., et al. 2022, ApJS, 263, 13 [NASA ADS] [CrossRef] [Google Scholar]
- Méndez-Delgado, J. E., Amayo, A., Arellano-Córdova, K. Z., et al. 2022, MNRAS, 510, 4436 [CrossRef] [Google Scholar]
- Mezger, P. G. 1980, in Radio Recombination Lines, ed. P. A. Shaver, Astrophys. Space Sci. Lib., 80, 81 [NASA ADS] [CrossRef] [Google Scholar]
- Nemer, A., Sterling, N. C., Raymond, J., et al. 2019, ApJ, 887, L9 [NASA ADS] [CrossRef] [Google Scholar]
- Nussbaumer, H., & Storey, P. J. 1983, A&A, 126, 75 [NASA ADS] [Google Scholar]
- O’Dell, C. R., & Yusef-Zadeh, F. 2000, AJ, 120, 382 [CrossRef] [Google Scholar]
- Olofsson, H., Black, J. H., Khouri, T., et al. 2021, A&A, 651, A35 [NASA ADS] [CrossRef] [EDP Sciences] [Google Scholar]
- Pabst, C. H. M., Goicoechea, J. R., Hacar, A., et al. 2022, A&A, 658, A98 [NASA ADS] [CrossRef] [EDP Sciences] [Google Scholar]
- Peimbert, M. 1967, ApJ, 150, 825 [NASA ADS] [CrossRef] [Google Scholar]
- Peimbert, M., Storey, P. J., & Torres-Peimbert, S. 1993, ApJ, 414, 626 [NASA ADS] [CrossRef] [Google Scholar]
- Salas, P., Oonk, J. B. R., Emig, K. L., et al. 2019, A&A, 626, A70 [NASA ADS] [CrossRef] [EDP Sciences] [Google Scholar]
- Simón-Díaz, S., & Stasińska, G. 2008, MNRAS, 389, 1009 [CrossRef] [Google Scholar]
- Simpson, J. P., Rubin, R. H., Erickson, E. F., & Haas, M. R. 1986, ApJ, 311, 895 [NASA ADS] [CrossRef] [Google Scholar]
- Storey, P. J. 1981, MNRAS, 195, 27P [CrossRef] [Google Scholar]
- Terzian, Y. 1980, in Radio Recombination Lines, ed. P. A. Shaver, Astrophys. Space Sci. Lib., 80, 75 [NASA ADS] [CrossRef] [Google Scholar]
- Tiesinga, E., Mohr, P. J., Newell, D. B., & Taylor, B. N. 2021, Rev. Mod. Phys., 93, 025010 [NASA ADS] [CrossRef] [Google Scholar]
- Towle, J. P., Feldman, P. A., & Watson, J. K. G. 1996, ApJS, 107, 747 [NASA ADS] [CrossRef] [Google Scholar]
- Vallee, J. P., Guilloteau, S., Forveille, T., & Omont, A. 1990, A&A, 230, 457 [NASA ADS] [Google Scholar]
- Walmsley, C. M., Churchwell, E., & Terzian, Y. 1981, A&A, 96, 278 [NASA ADS] [Google Scholar]
- Walter, D. K. 1991, PASP, 103, 830 [NASA ADS] [CrossRef] [Google Scholar]
- Wang, J. Q., Yu, L. F., Jiang, Y. B., et al. 2017, Acta Astron. Sin., 58, 37 [Google Scholar]
- Wilson, T. L., Filges, L., Codella, C., Reich, W., & Reich, P. 1997, A&A, 327, 1177 [NASA ADS] [Google Scholar]
- Zhang, C.-P., Xu, J.-L., Li, G.-X., et al. 2021, Research in Astron. Astrophys., 21, 209 [Google Scholar]
- Zhu, F. Y., Wang, J. Z., Zhu, Q. F., & Zhang, J. S. 2022, A&A, 665, A94 [NASA ADS] [CrossRef] [EDP Sciences] [Google Scholar]
All Tables
All Figures
|
Fig. 1. Contours of SCUBA 850 μm dust emission (Orion KL; Di Francesco et al. 2008) overlaid on the 6 cm VLA continuum image of the M 42 H II region. The red cross is IRc2 of Orion KL (RA(J2000) = 05:35:14.55, Dec(J2000) = −05:22:31.0). The red pentagram denotes θ1 Ori C (RA(J2000) = 5:35:16.47, Dec(J2000) = −5:23:22.9), an O6-type star that is the dominant ionization source of M 42 (O’Dell & Yusef-Zadeh 2000). The pink, green, and black circles represent the beams of TMRT in Ka, Ku, and Q bands, respectively (Sect. 2). |
| In the text | |
|
Fig. 2. Spliced spectrum (blue line) of Orion KL around the rest frequencies of RRLs of ions (C II or O II) in Ka band (upper panel), Ku band (middle panel), and Q band (lower panel). The Ka/Q spectra have been smoothed to have a spectral resolution (Δν) of 366.212 kHz. The Ku spectrum is unsmoothed with a Δν of 30.517 kHz. Segments separated by gray vertical lines cover different frequency ranges. The transition labels and the rest frequencies of the corresponding C II transitions (in unit of MHz) are shown on the top axis. The solid red line represents the model fitting of XII RRLs (Table 2). The dashed line includes the contributions of all the RRLs as well as all transitions of molecules identified in the Q-band survey (Liu et al. 2022) and Ka-band survey. |
| In the text | |
|
Fig. 3. Comparison between the spectra towards Orion KL (black) and towards θ1 Ori C (red) shown on the left. Comparison between the spectra towards Orion KL observed on different days shown on the right. |
| In the text | |
Current usage metrics show cumulative count of Article Views (full-text article views including HTML views, PDF and ePub downloads, according to the available data) and Abstracts Views on Vision4Press platform.
Data correspond to usage on the plateform after 2015. The current usage metrics is available 48-96 hours after online publication and is updated daily on week days.
Initial download of the metrics may take a while.