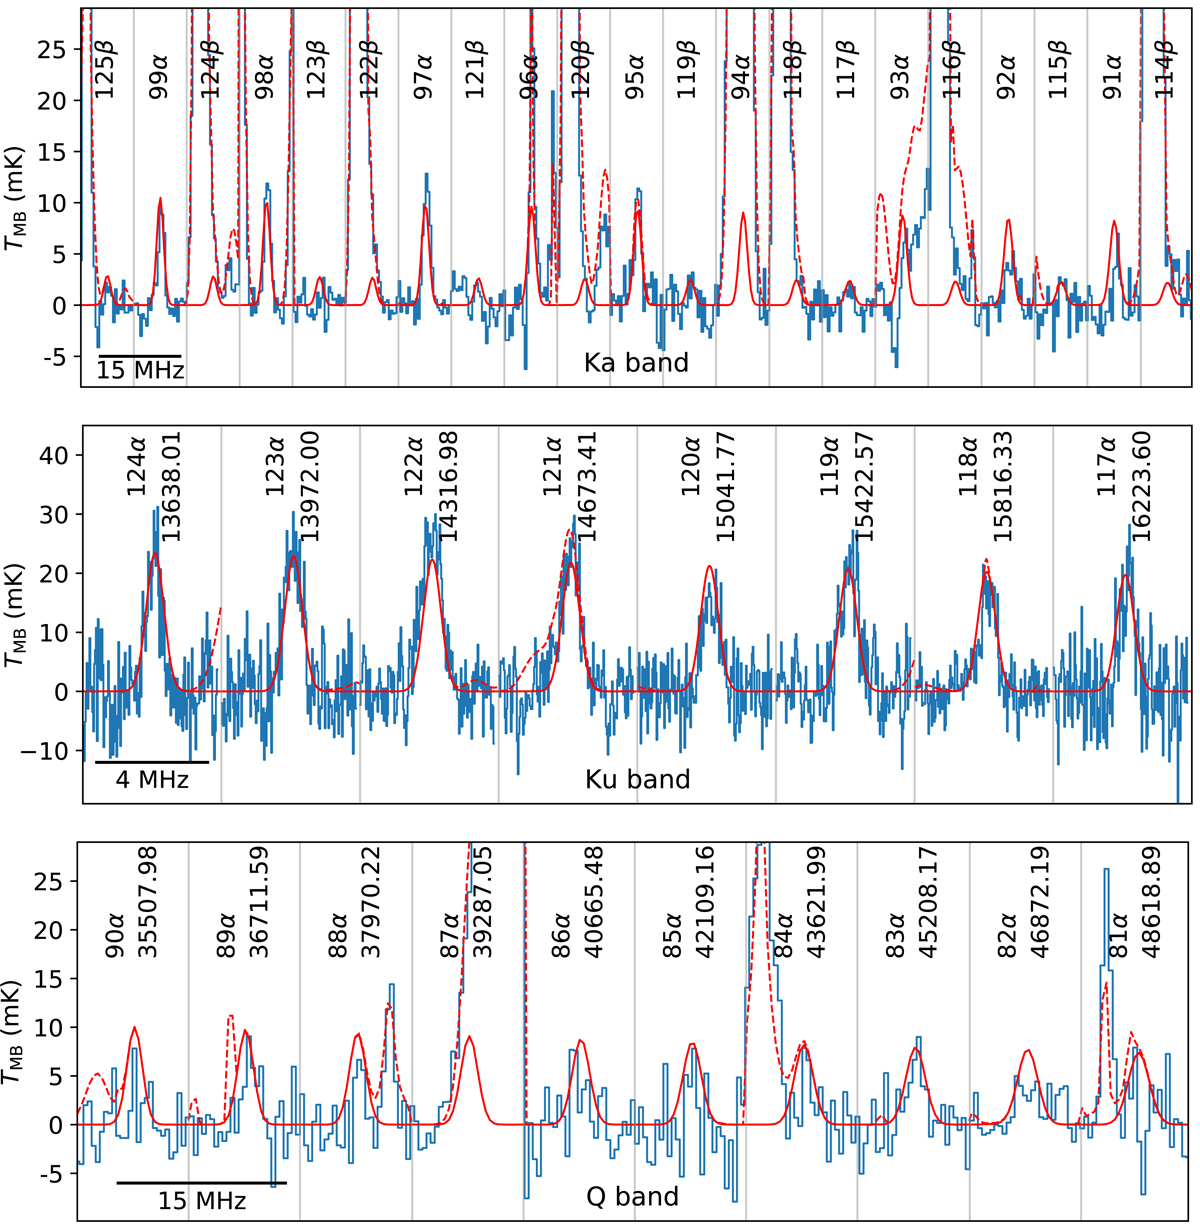
Fig. 2.
Download original image
Spliced spectrum (blue line) of Orion KL around the rest frequencies of RRLs of ions (C II or O II) in Ka band (upper panel), Ku band (middle panel), and Q band (lower panel). The Ka/Q spectra have been smoothed to have a spectral resolution (Δν) of 366.212 kHz. The Ku spectrum is unsmoothed with a Δν of 30.517 kHz. Segments separated by gray vertical lines cover different frequency ranges. The transition labels and the rest frequencies of the corresponding C II transitions (in unit of MHz) are shown on the top axis. The solid red line represents the model fitting of XII RRLs (Table 2). The dashed line includes the contributions of all the RRLs as well as all transitions of molecules identified in the Q-band survey (Liu et al. 2022) and Ka-band survey.
Current usage metrics show cumulative count of Article Views (full-text article views including HTML views, PDF and ePub downloads, according to the available data) and Abstracts Views on Vision4Press platform.
Data correspond to usage on the plateform after 2015. The current usage metrics is available 48-96 hours after online publication and is updated daily on week days.
Initial download of the metrics may take a while.