Fig. 9.
Download original image
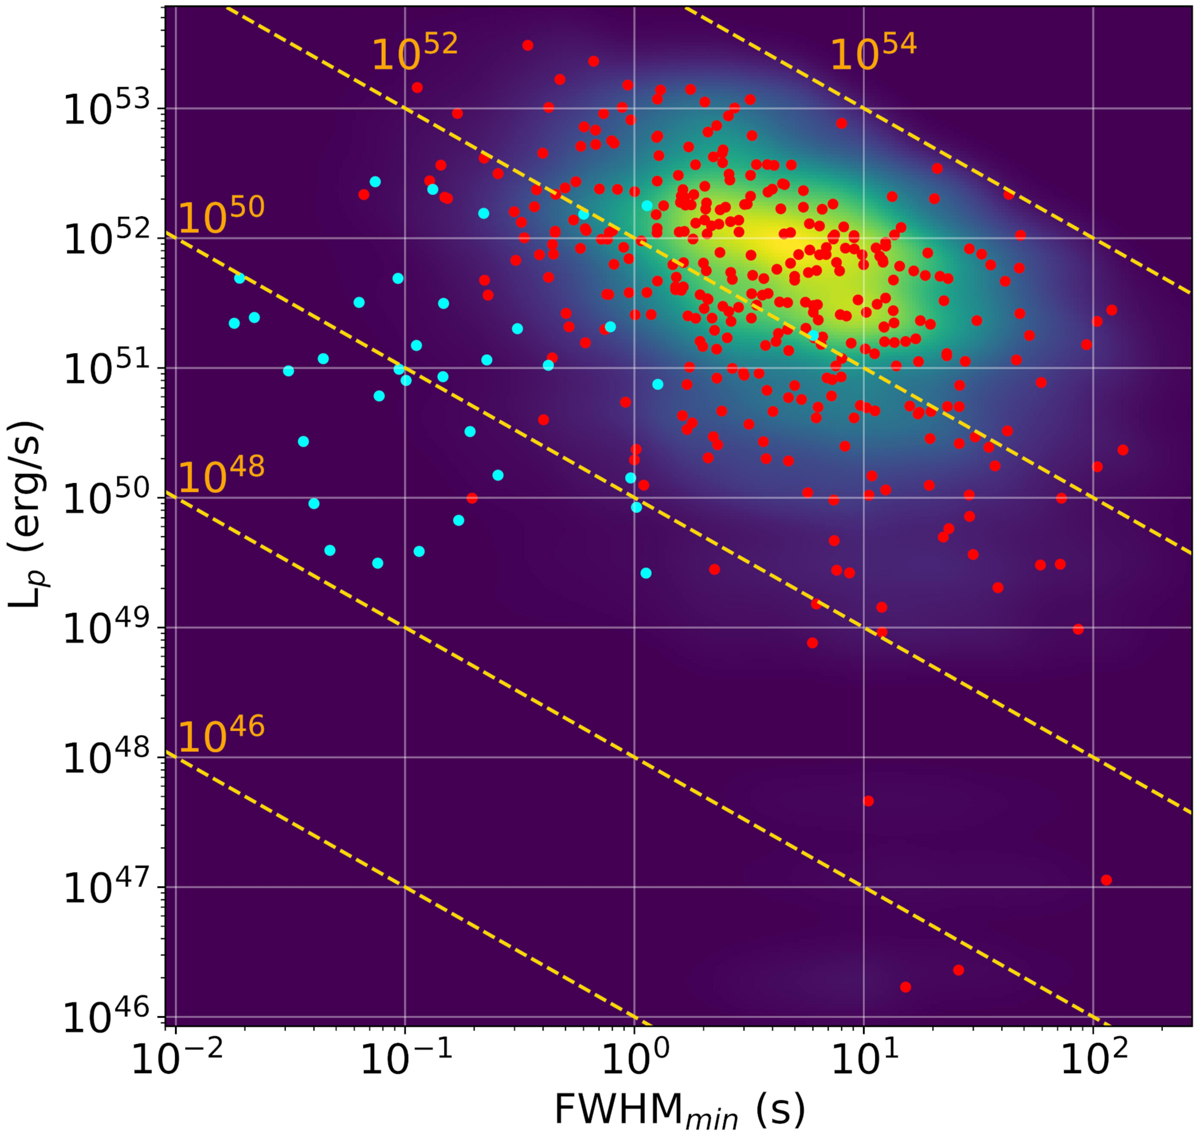
Peak Luminosity Lp versus FWHMmin for the Swift/BAT Type-II GRB sample (red circles). The colour-coded density map is the result of a simulated sample of Type-II GRBs that accounts for the selection effects shown in Fig. 8 under the assumption of no correlation between Lp and FWHMmin. For comparison, we also show SGRBs (cyan circles). Gold dashed lines represent loci with constant isotropic-equivalent released energy of each individual peak, approximately calculated as Eiso = Lp FWHMmin.
Current usage metrics show cumulative count of Article Views (full-text article views including HTML views, PDF and ePub downloads, according to the available data) and Abstracts Views on Vision4Press platform.
Data correspond to usage on the plateform after 2015. The current usage metrics is available 48-96 hours after online publication and is updated daily on week days.
Initial download of the metrics may take a while.