Fig. 8.
Download original image
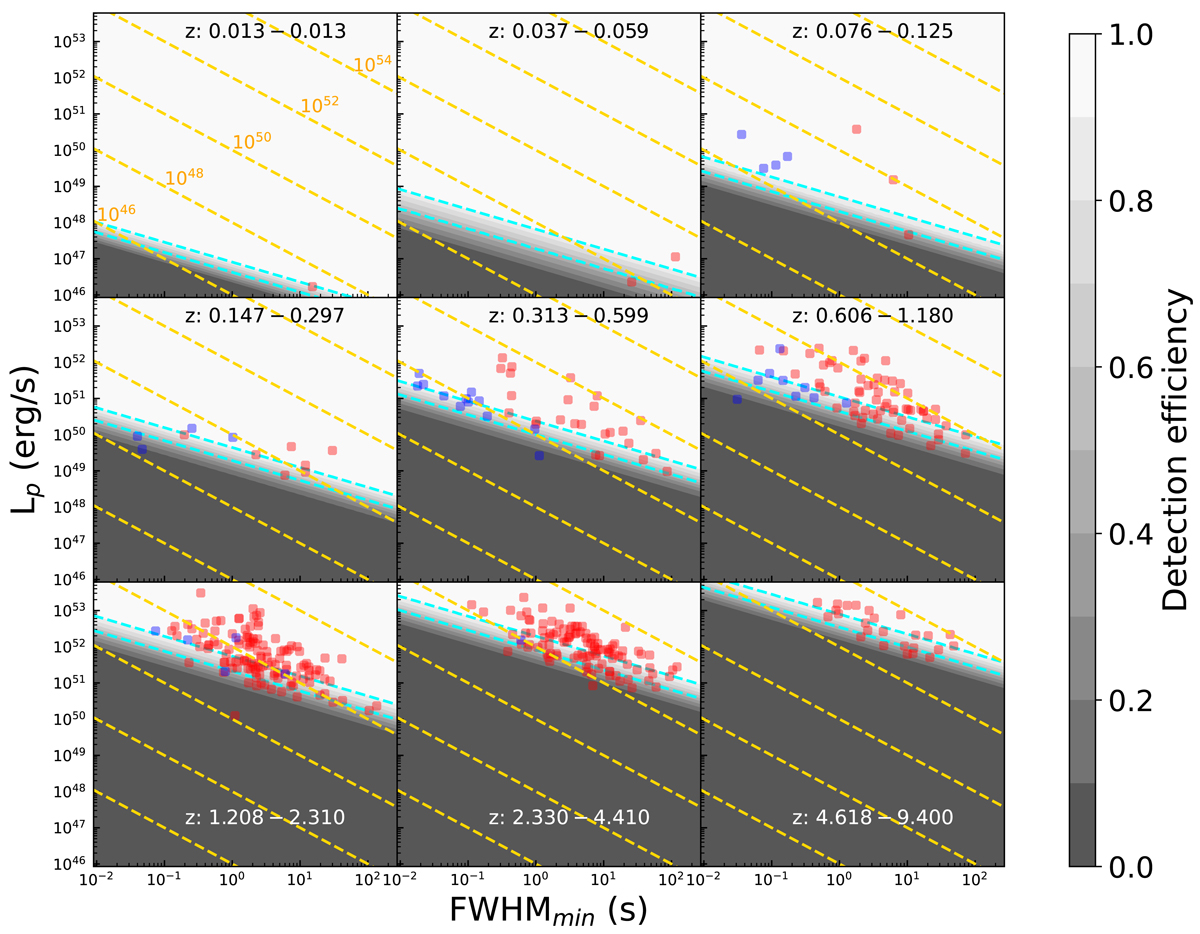
Peak luminosity versus FWHMmin for the Swift/BAT sample split into nine redshift bins with constant logarithmic space in luminosity distance; blue dots correspond to Type-I GRBs, and red ones correspond to Type-II GRBs. Dashed cyan lines correspond to 90% and 50% detection efficiency (vertical bar). Gold dashed lines represent loci of constant isotropic-equivalent released energy (in erg) of each individual peak, approximately calculated as Eiso = Lp FWHMmin.
Current usage metrics show cumulative count of Article Views (full-text article views including HTML views, PDF and ePub downloads, according to the available data) and Abstracts Views on Vision4Press platform.
Data correspond to usage on the plateform after 2015. The current usage metrics is available 48-96 hours after online publication and is updated daily on week days.
Initial download of the metrics may take a while.