Fig. 7.
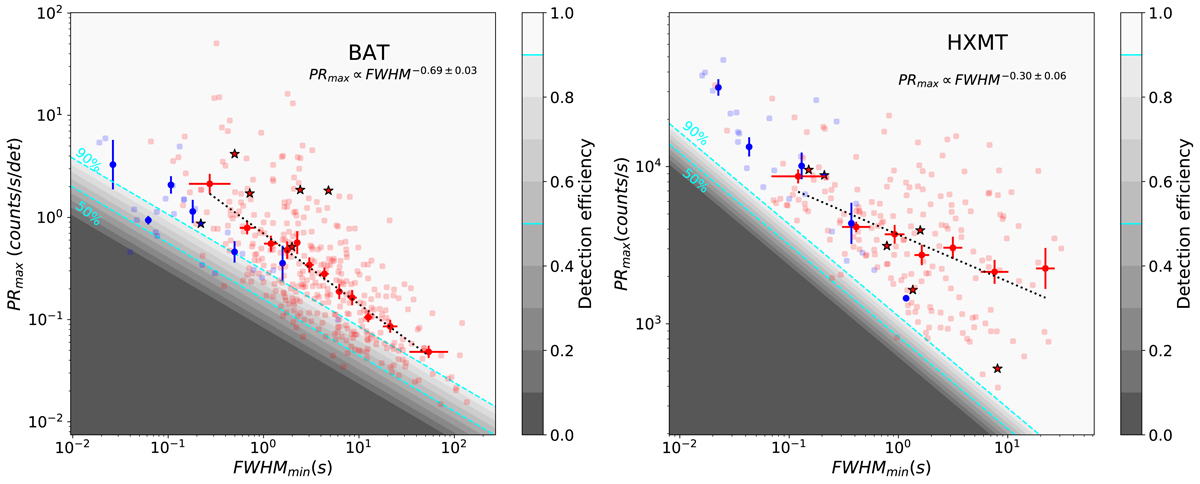
Download original image
Peak rate versus FWHMmin for the Swift (left) and HXMT (right) samples. Blue dots correspond to Type-I GRBs (i.e. SGRBs and SEE-GRBs), and red ones correspond to Type-II GRBs. Lighter dots refer to single GRB data, darker ones refer to geometrical mean of data of groups of GRBs sorted with increasing z. For Type-I, each group is composed 6 of GRBs; for Type-II, each group is composed of 30 GRBs. Stars refer to the six GRBs in common between the Swift sample and HXMT sample. Dotted lines indicate the best fit of Type-II GRBs. The shaded areas show ten different regions with detection efficiency spanning the 0−1 range. Cyan dashed lines show the 50% and 90% detection efficiency contours.
Current usage metrics show cumulative count of Article Views (full-text article views including HTML views, PDF and ePub downloads, according to the available data) and Abstracts Views on Vision4Press platform.
Data correspond to usage on the plateform after 2015. The current usage metrics is available 48-96 hours after online publication and is updated daily on week days.
Initial download of the metrics may take a while.