Open Access
Fig. 6.
Download original image
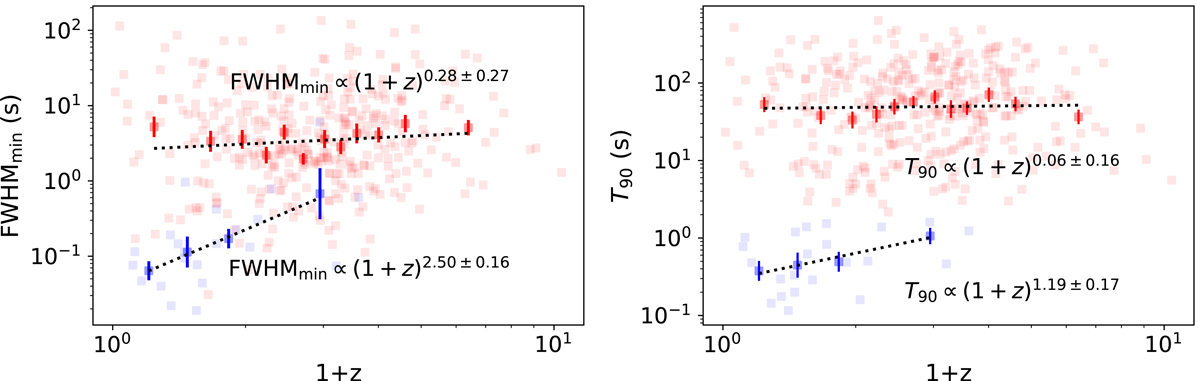
FWHMmin versus (1 + z) (left panel) and T90 versus (1 + z) (right panel) for the Swift sample as seen in the observer frame. Red (blue) dots correspond to LGRBs (SGRBs). Lighter dots refer to individual GRBs; darker ones refer to T90 geometrical mean of groups of 30 (6) LGRBs (SGRBs), sorted with increasing z.
Current usage metrics show cumulative count of Article Views (full-text article views including HTML views, PDF and ePub downloads, according to the available data) and Abstracts Views on Vision4Press platform.
Data correspond to usage on the plateform after 2015. The current usage metrics is available 48-96 hours after online publication and is updated daily on week days.
Initial download of the metrics may take a while.