Fig. 5.
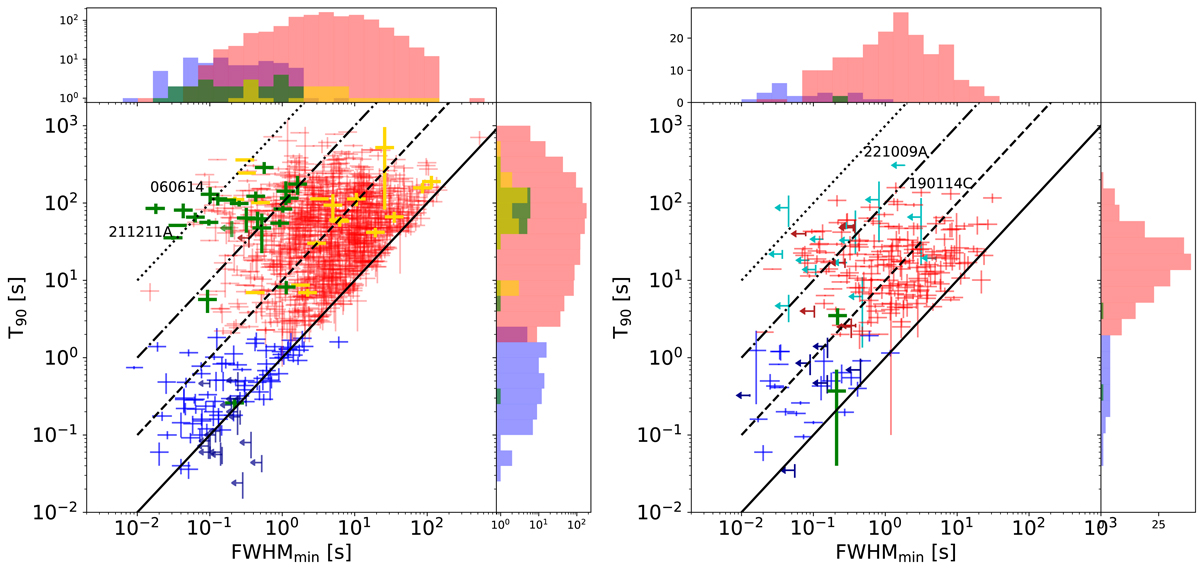
Download original image
Scatter plot of FWHMmin and T90 for the Swift/BAT sample (left panel) and for the Insight-HXMT sample (right panel) along with the corresponding marginal distributions for three distinct populations of SGRBs (blue), LGRBs (red), and SEE-GRBs (green). Gold points are LGRBs with an associated SN. We highlight two SEE-GRBs, 060614 and 211211A, for which there is strong evidence of a binary merger rather than a collapsar origin. Cyan points refer to the Insight-HXMT saturated GRBs. We highlight 190114C and 221009A because of their high extreme energy (MAGIC Collaboration 2019; Frederiks et al. 2022). We do not consider Swift data where T90 < σT90. Solid, dashed, dash-dotted, and dotted lines represent the equality, 101, 102, and 103 factor, respectively.
Current usage metrics show cumulative count of Article Views (full-text article views including HTML views, PDF and ePub downloads, according to the available data) and Abstracts Views on Vision4Press platform.
Data correspond to usage on the plateform after 2015. The current usage metrics is available 48-96 hours after online publication and is updated daily on week days.
Initial download of the metrics may take a while.