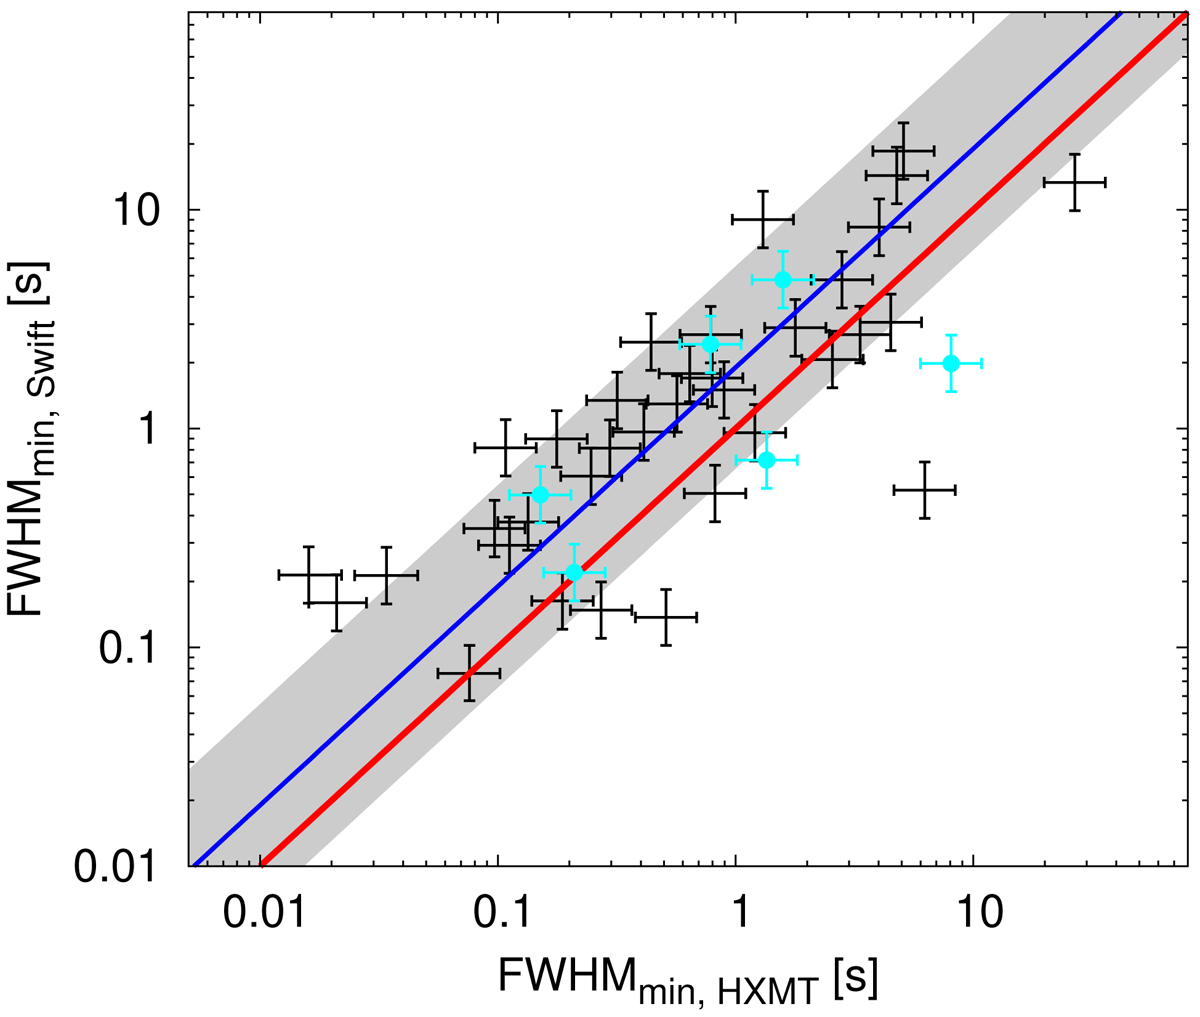
Fig. 3.
Download original image
FWHM as determined from Insight-HXMT/HE and Swift/BAT data for a sample of 44 GRBs in common. The red solid line shows the equality, while the blue line and the shaded area show the best proportionality relation and 1-σ region, corresponding to a factor of 2 and a relative scatter of a factor of 3, respectively. Cyan points are GRBs with spectroscopically measured redshift.
Current usage metrics show cumulative count of Article Views (full-text article views including HTML views, PDF and ePub downloads, according to the available data) and Abstracts Views on Vision4Press platform.
Data correspond to usage on the plateform after 2015. The current usage metrics is available 48-96 hours after online publication and is updated daily on week days.
Initial download of the metrics may take a while.