Fig. A.1.
Download original image
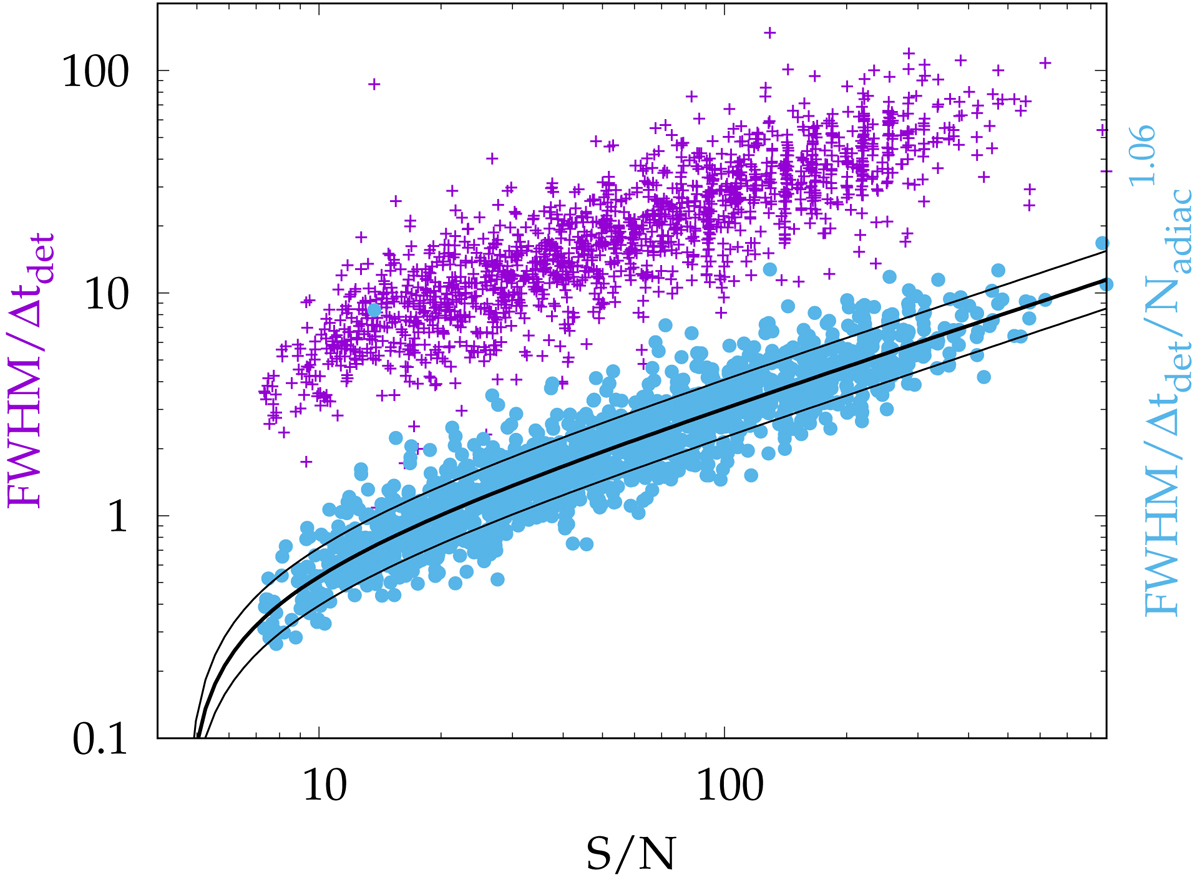
Ratio between true FWHM and MEPSA detection timescale Δ tdet (red crosses; left-hand side vertical axis) versus S/N for a sample of simulated GRB-like pulses. The right vertical axis displays the same ratio further divided by MEPSA parameter ![]() for the same data set (blue circles). The latter quantity is found to minimise the scatter around the best fitting relation.
for the same data set (blue circles). The latter quantity is found to minimise the scatter around the best fitting relation.
Current usage metrics show cumulative count of Article Views (full-text article views including HTML views, PDF and ePub downloads, according to the available data) and Abstracts Views on Vision4Press platform.
Data correspond to usage on the plateform after 2015. The current usage metrics is available 48-96 hours after online publication and is updated daily on week days.
Initial download of the metrics may take a while.